
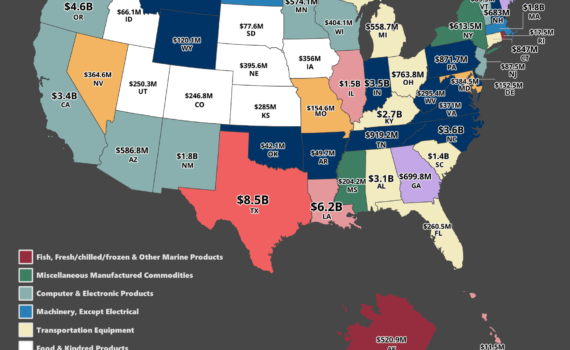
Mapped: The Largest Export Good to China of Every State This map visualizes the most significant export goods to China by each state. The Midwest overwhelmingly exports food and kindred products, including meat, dairy, vegetables, and grains. A good portion of the food products in the Midwest states were meat. […]
Trade
11 posts
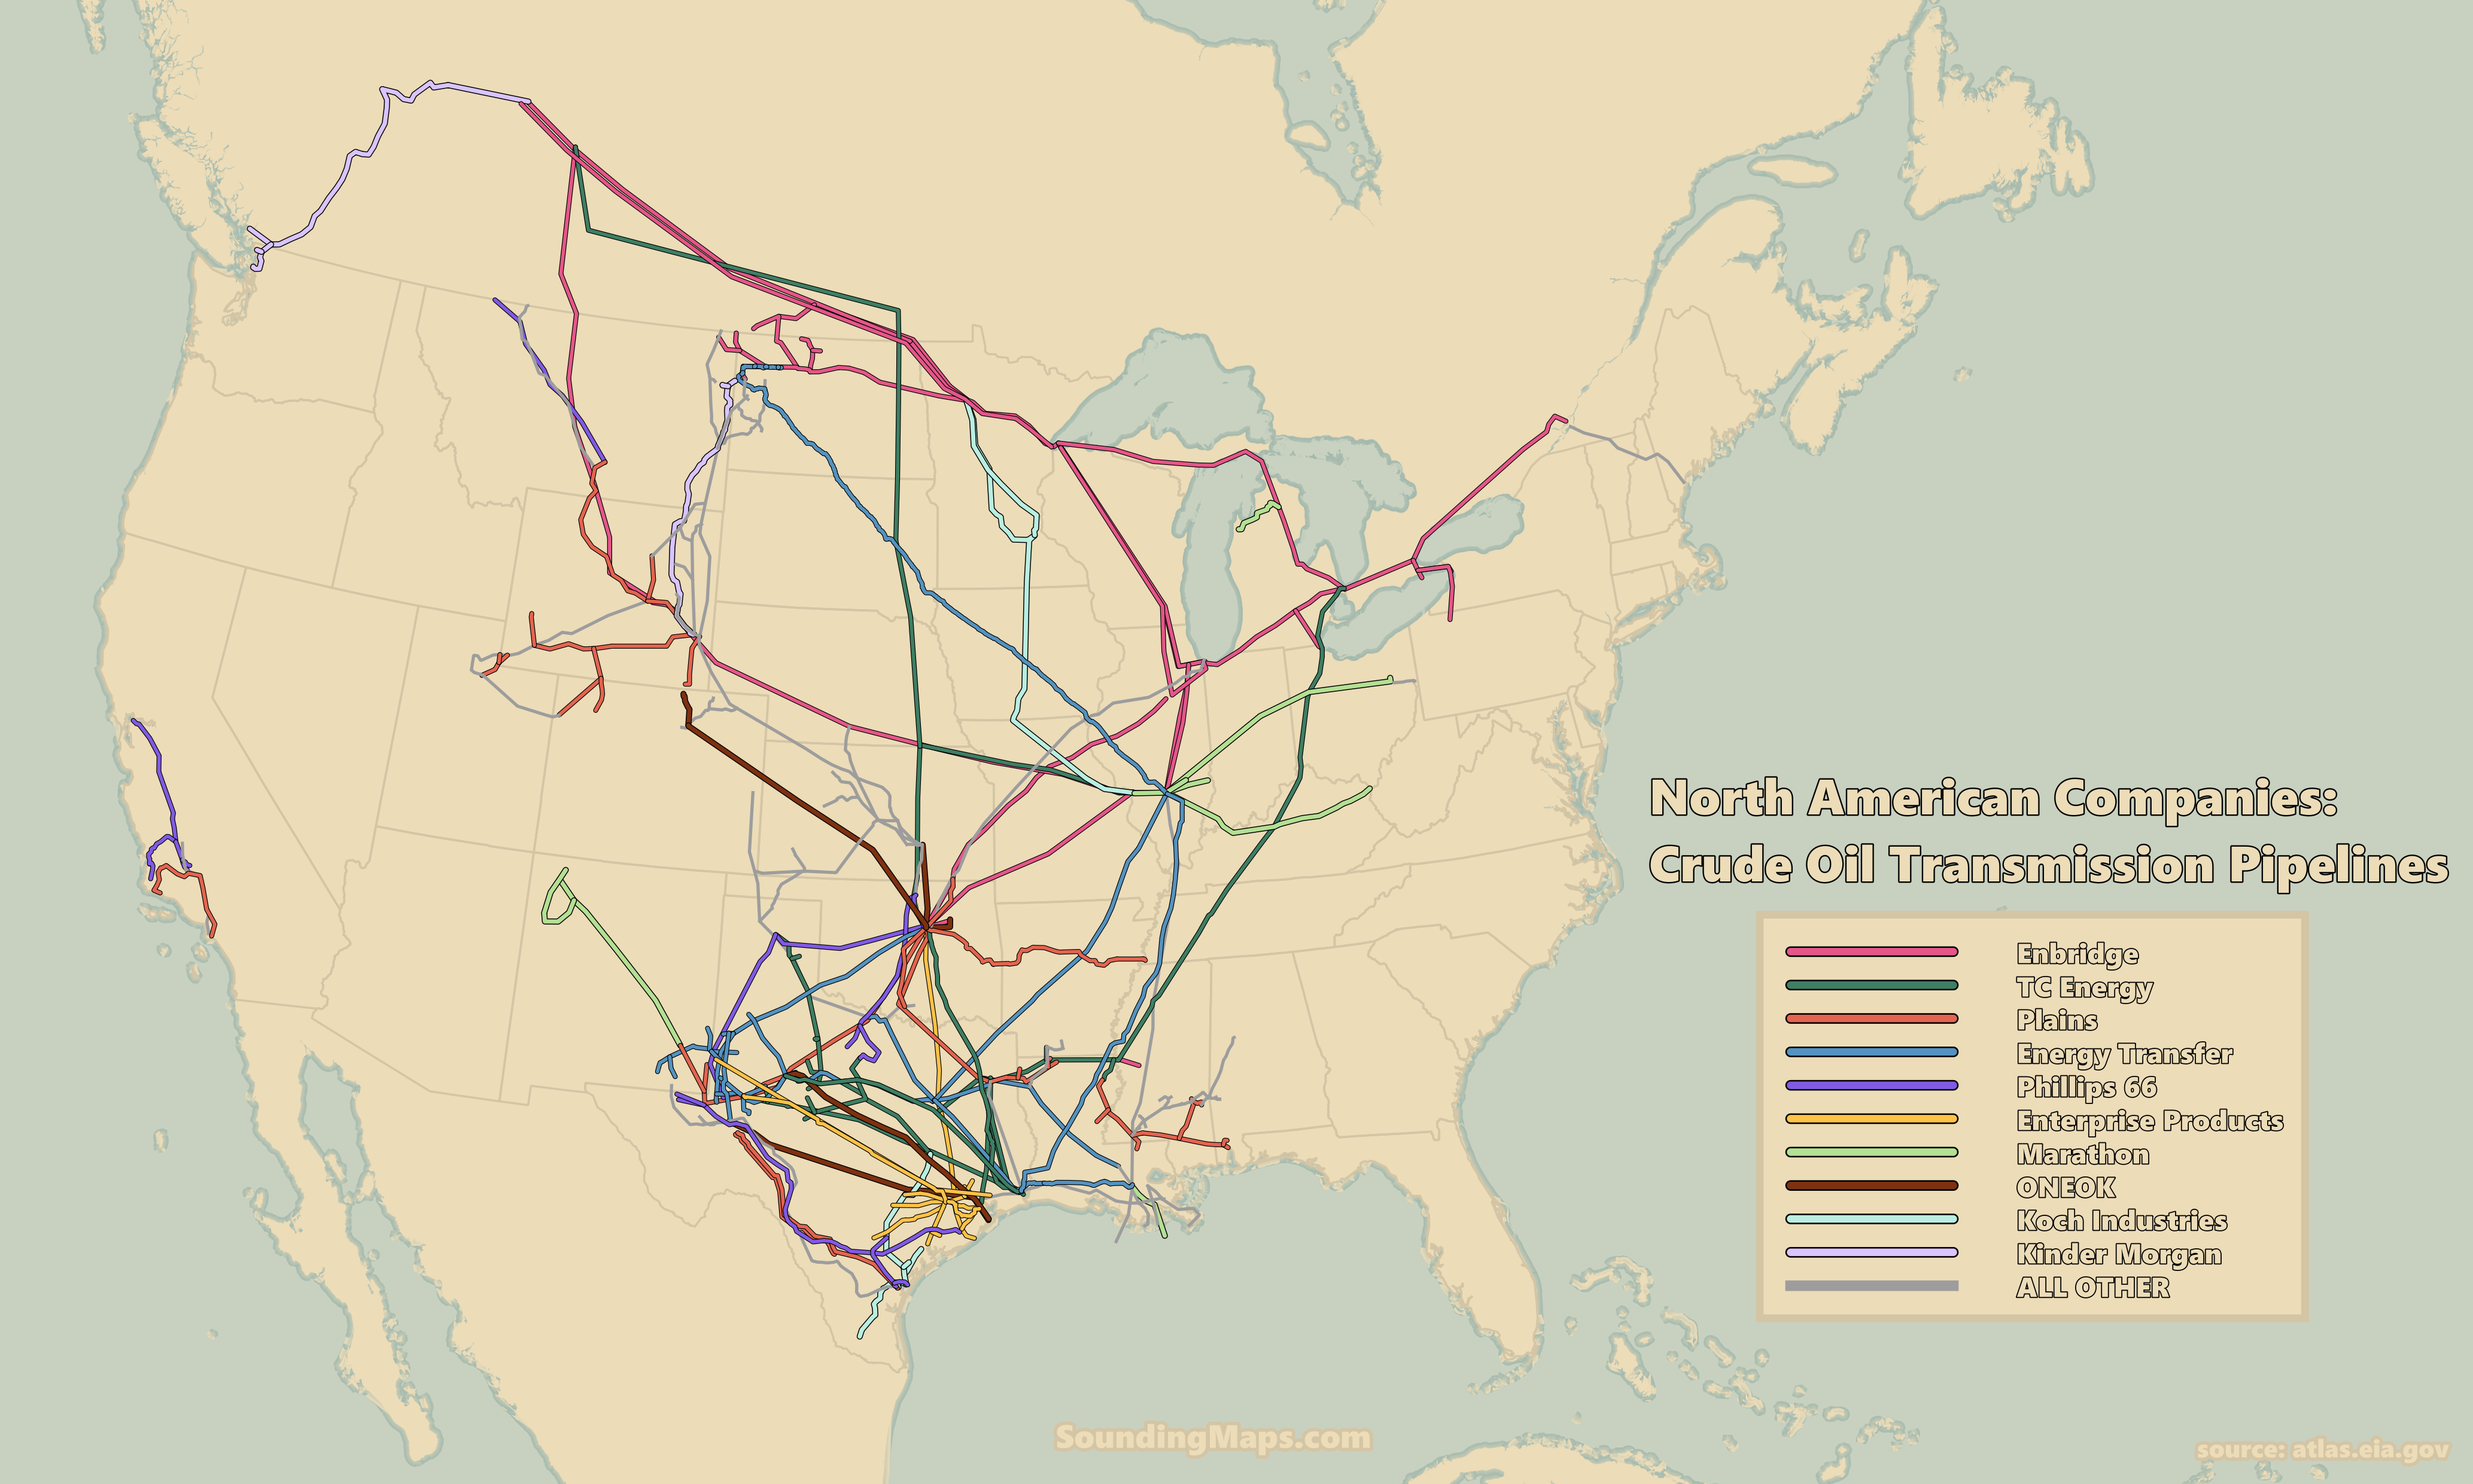
This map visualizes the ten significant companies’ dominance of crude oil transmission pipeline infrastructure throughout the United States and Canada. Selected by pipeline length, it is a map of the United States and Canada’s major crude oil pipeline networks. Ten North America crude oil companies dominate the energy transmission network. […]
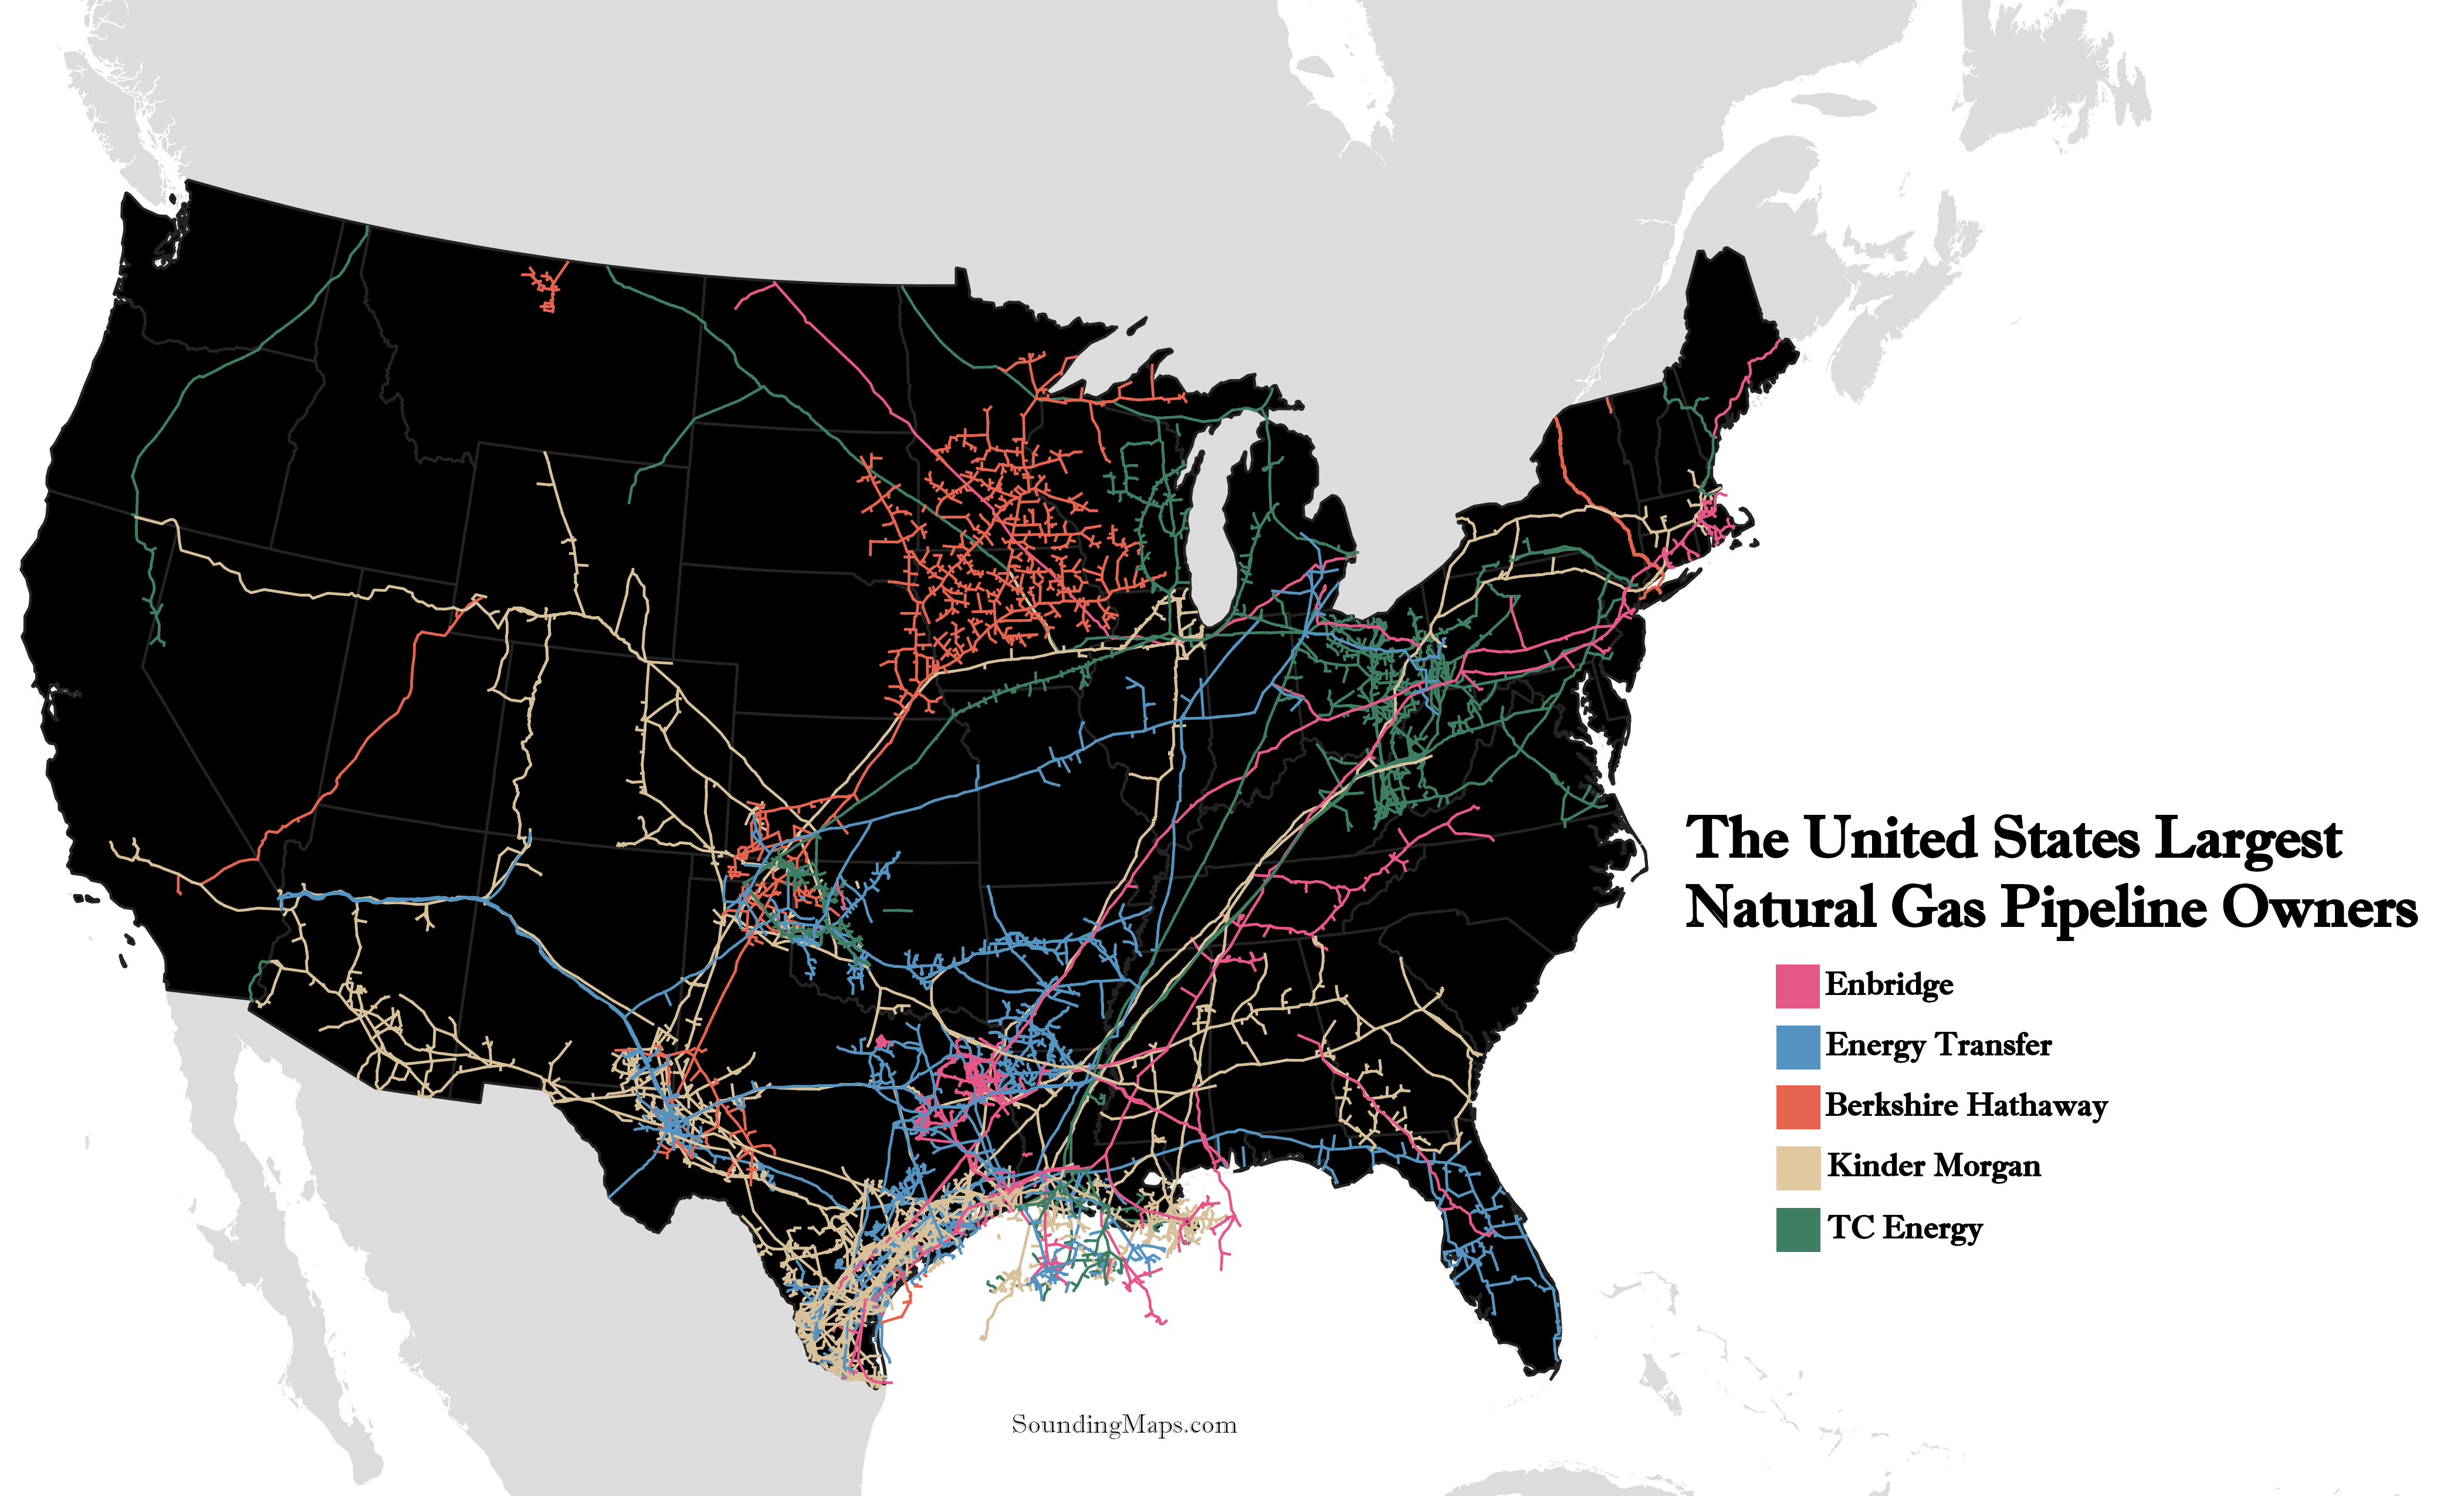
The Natural Gas Pipeline Landscape in the United States Categorized by pipeline company, this is the extensive map of natural gas pipelines in the United States. The natural gas pipelines in the US, are dominated by 5 large players. By exploring the map above, you’ll get a better understanding of […]
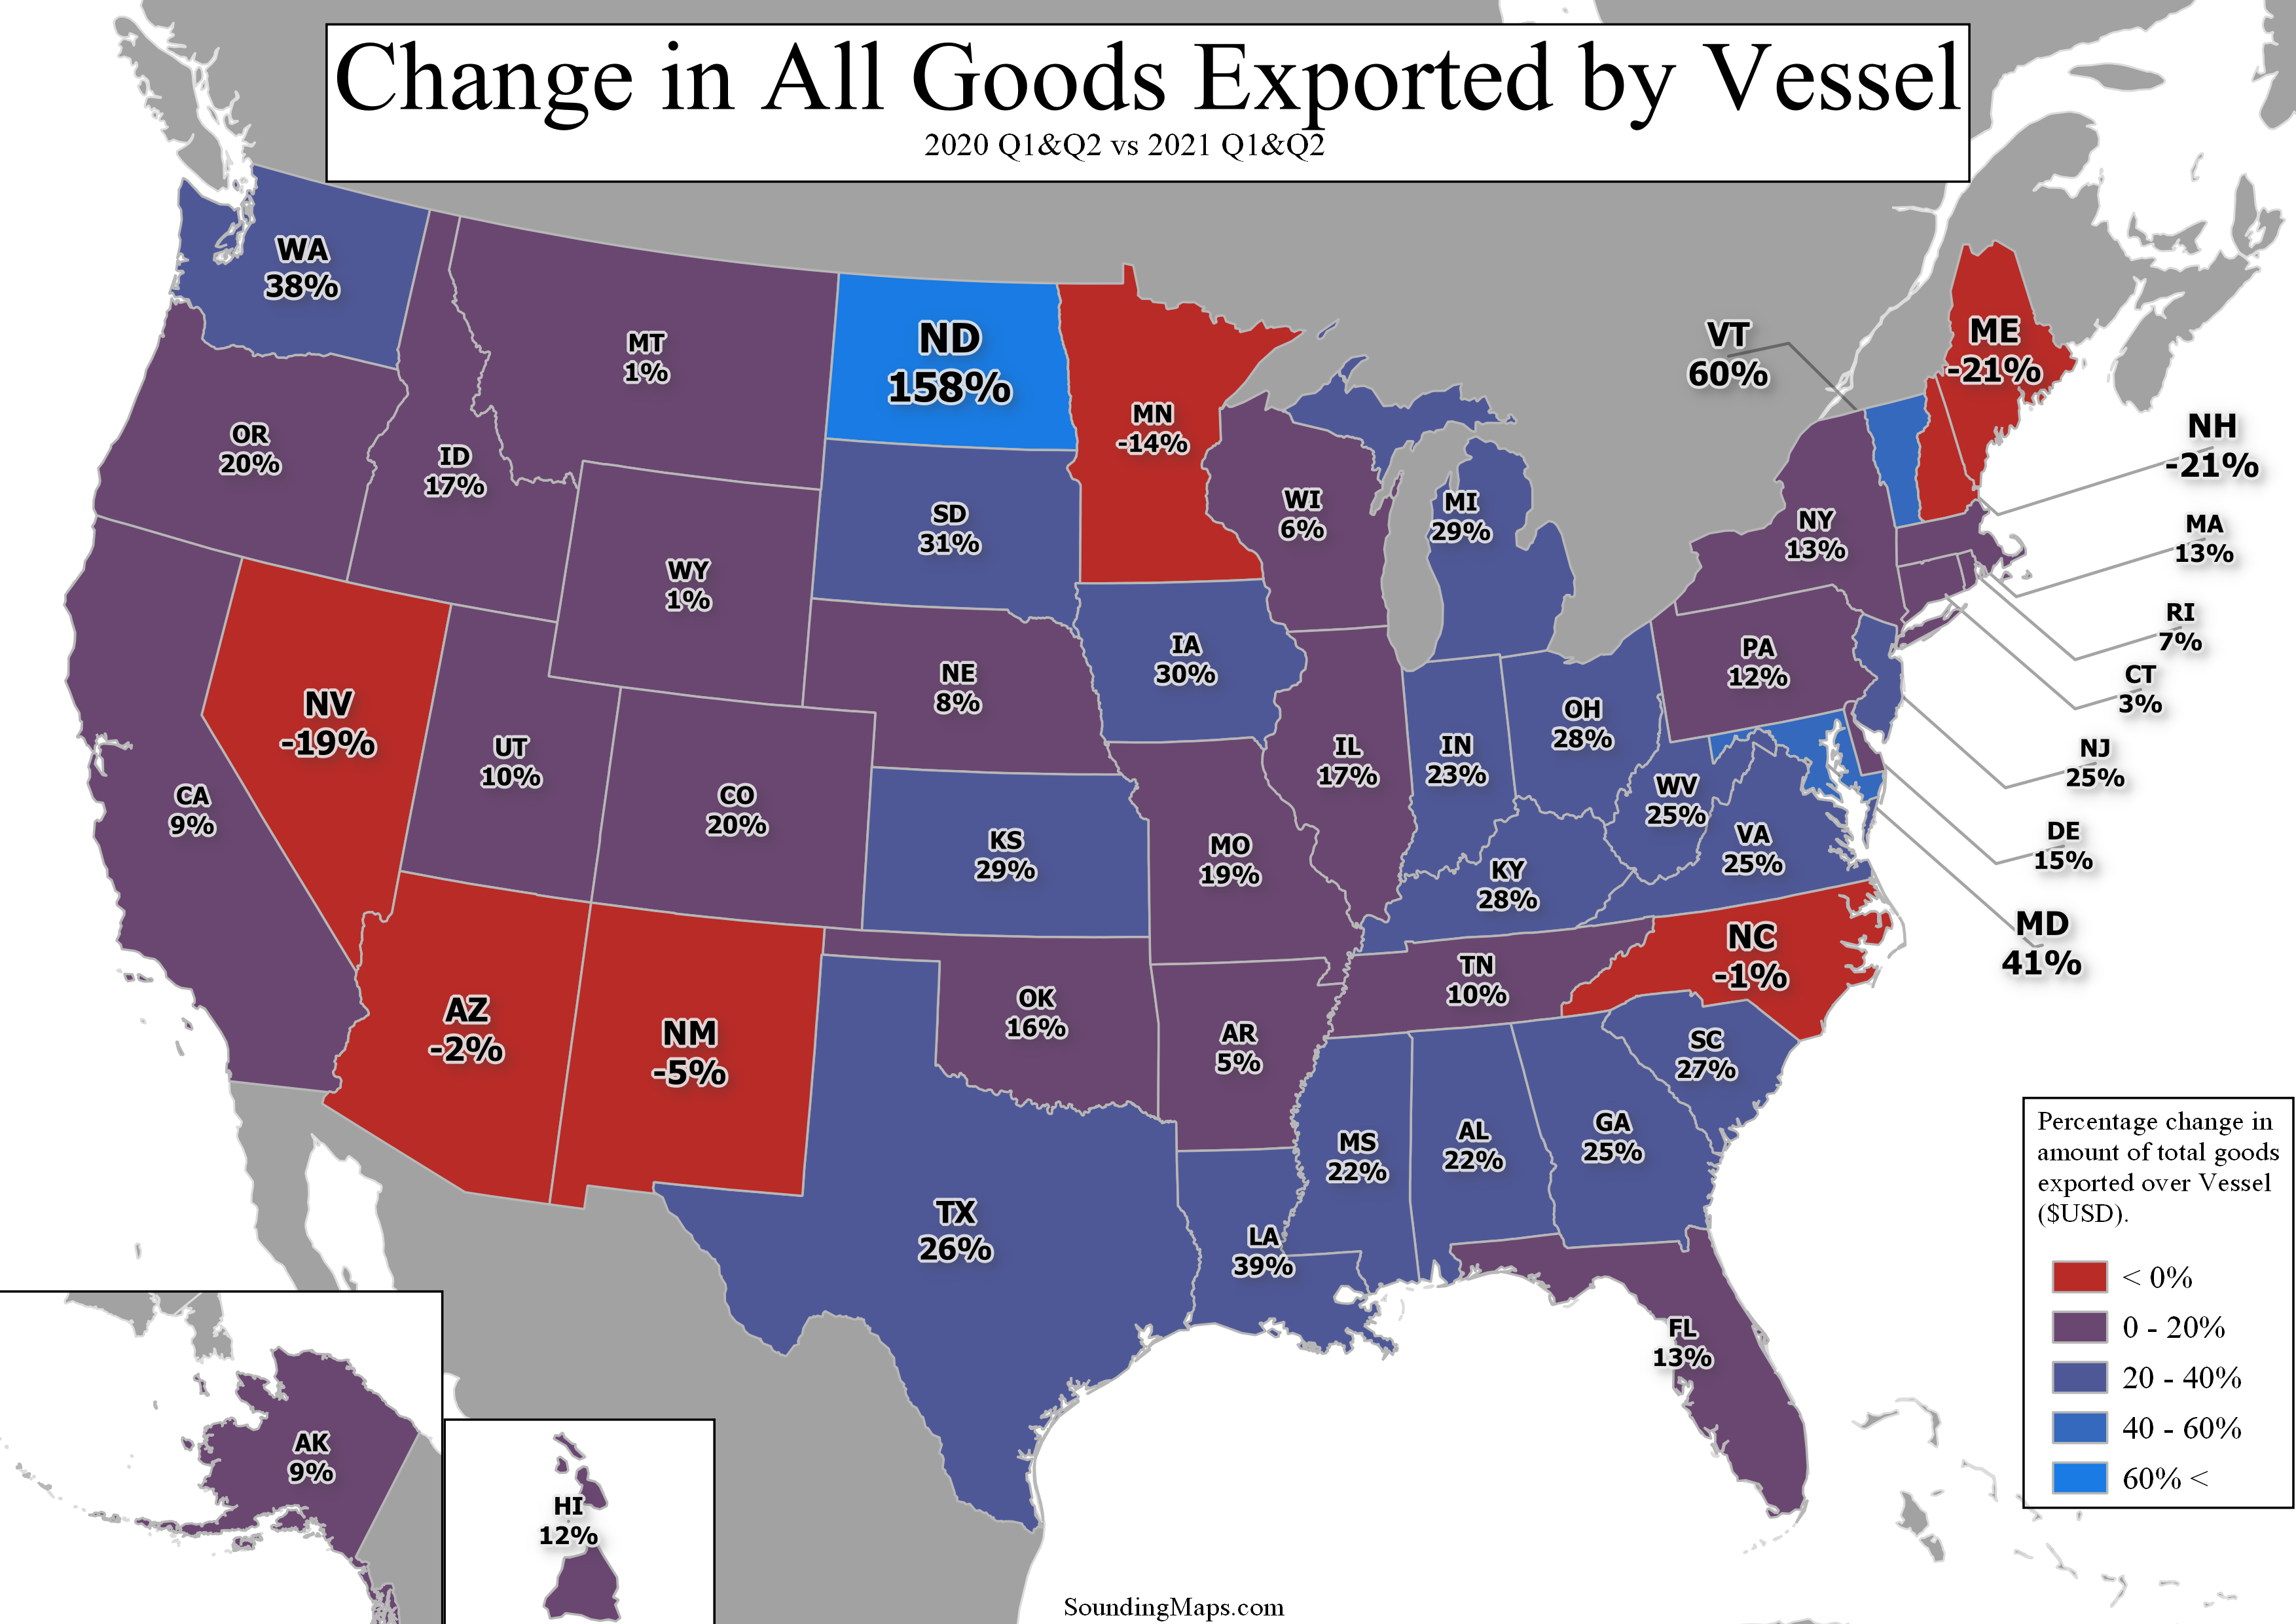
Now, this map shows key states that are adopting new modes of exporting goods. The mode being vessel. Vessel Exports Data was gathered from USA Trade Census and goods were classified using the HS code system. The vessel exports change was calculated taking the value of trade through vessel ports […]
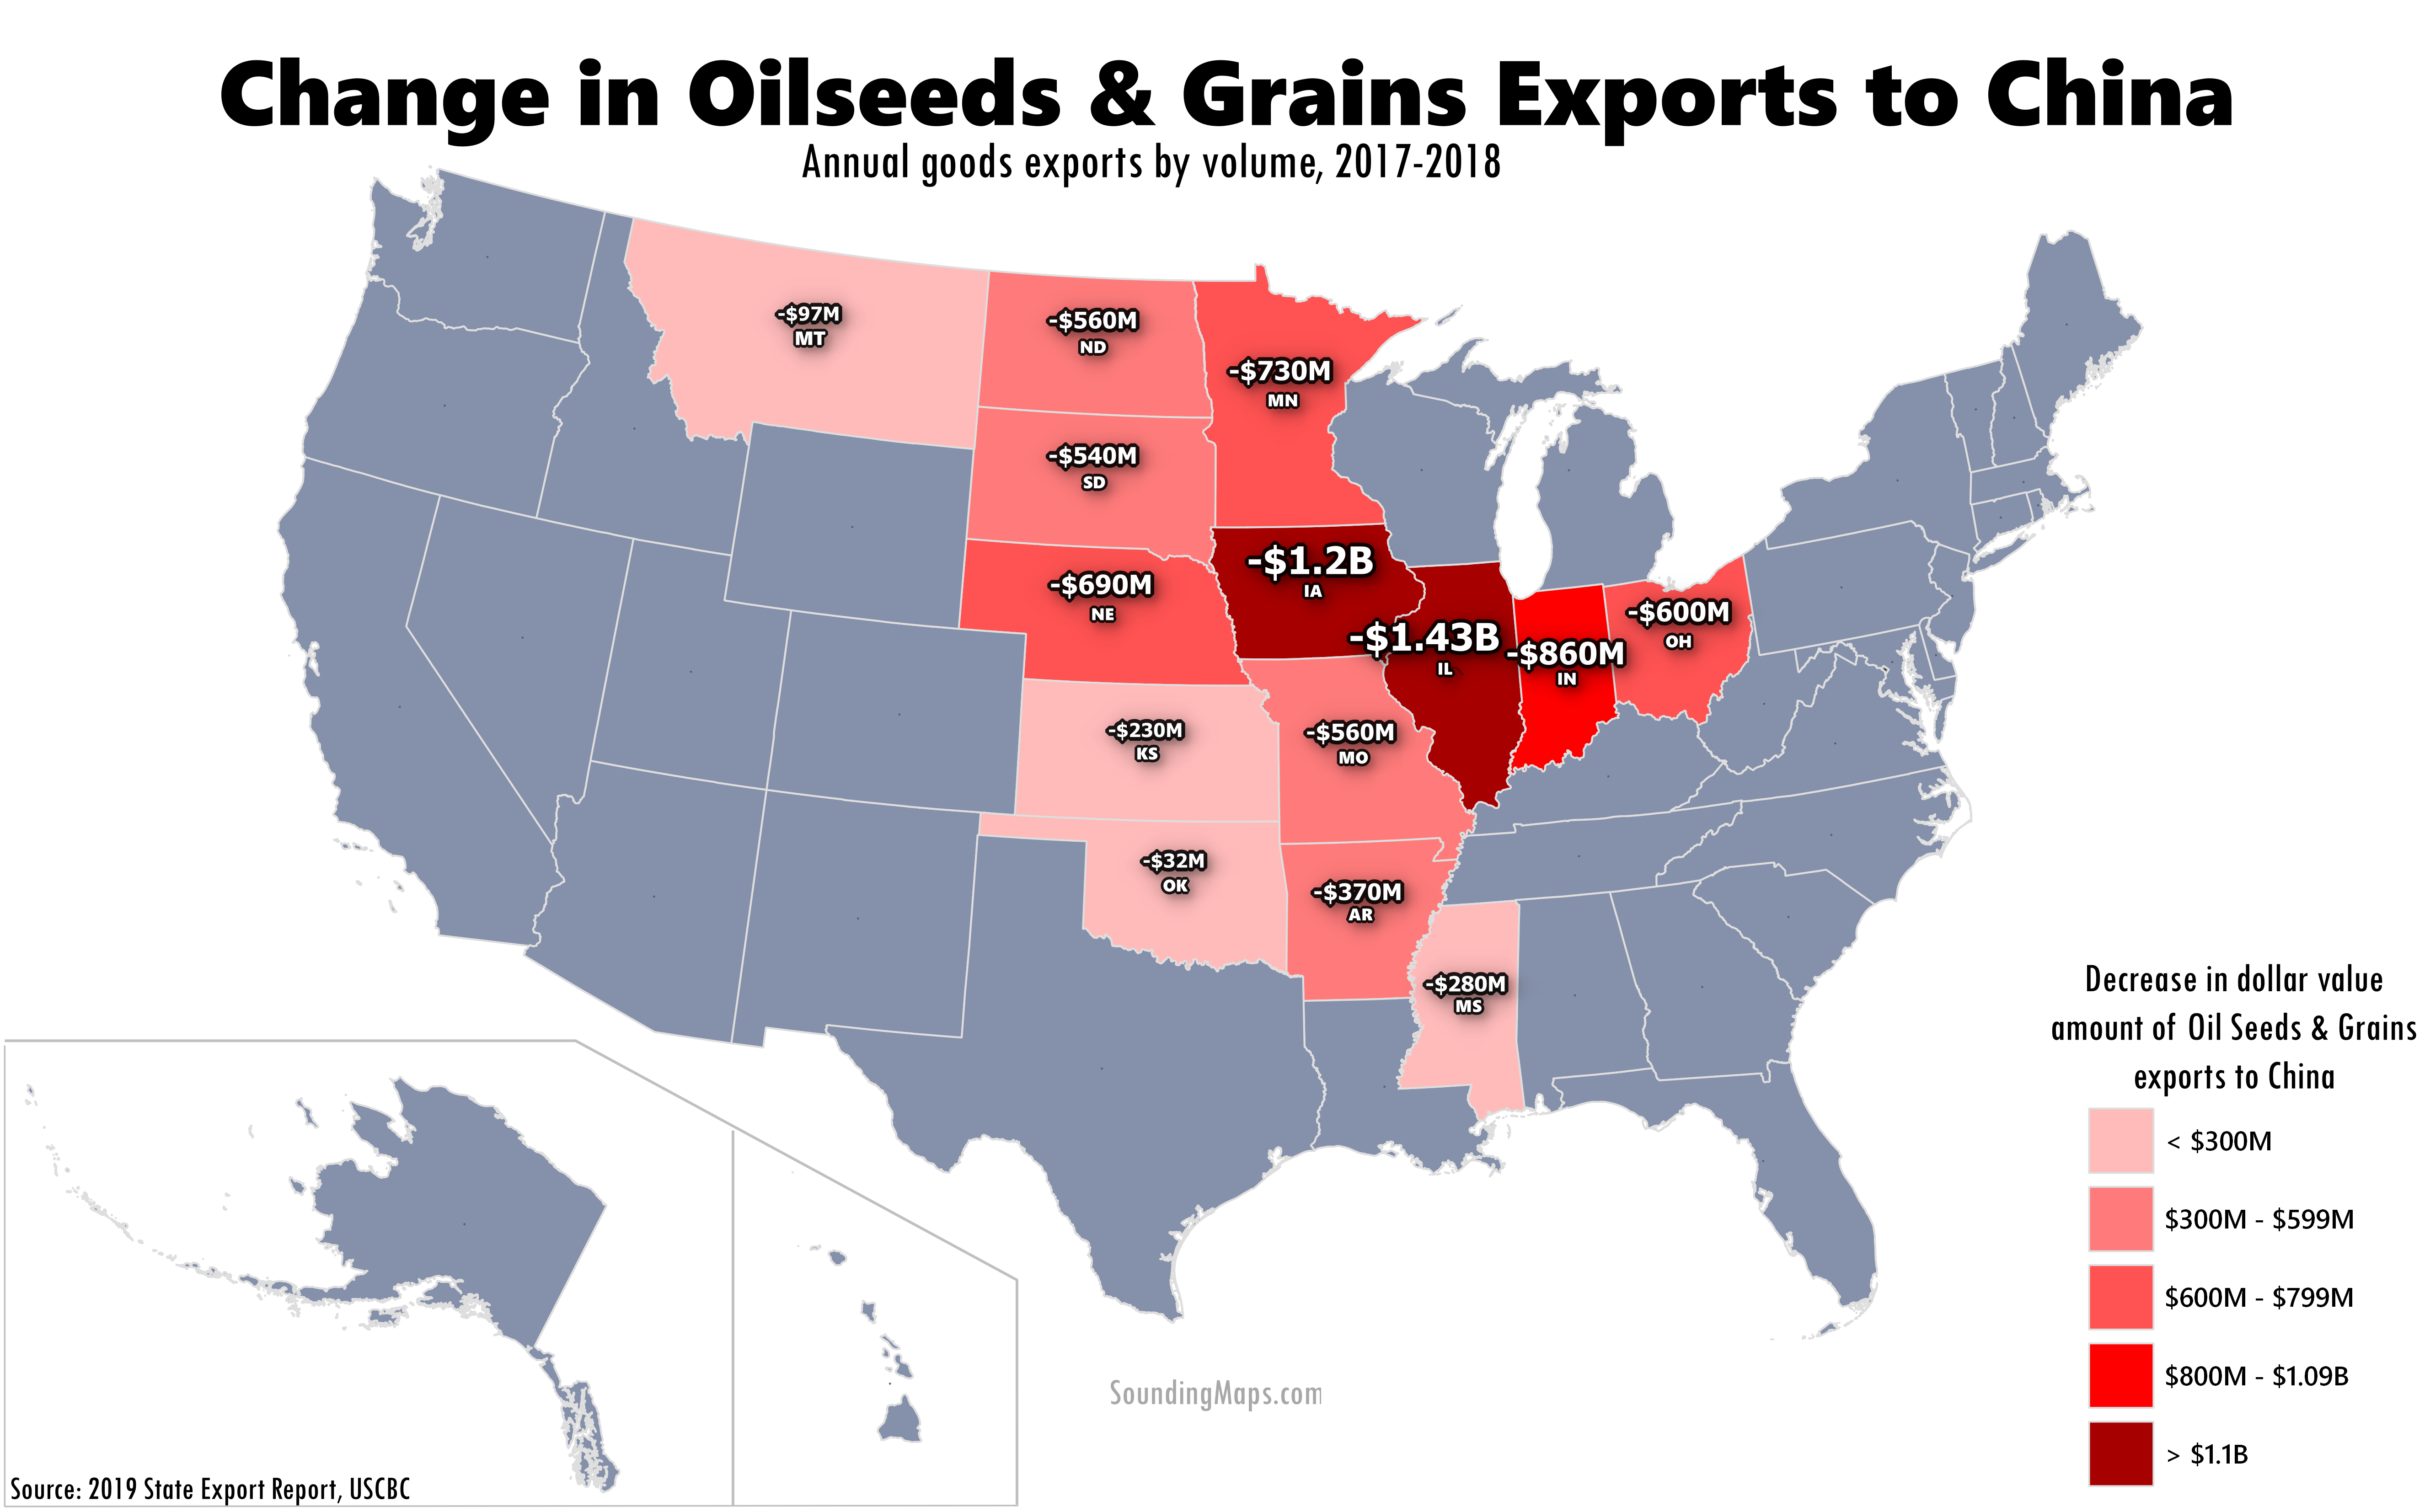
US China trade grain exports plunged between 2017 and 2018. China grain traders pulled back substantially on American Oilseeds & Grains between 2017 and 2018. The fourteen states colored above represent the top exporters of the product. Despite the decline, goods exports to China still outpaced export growth to the […]
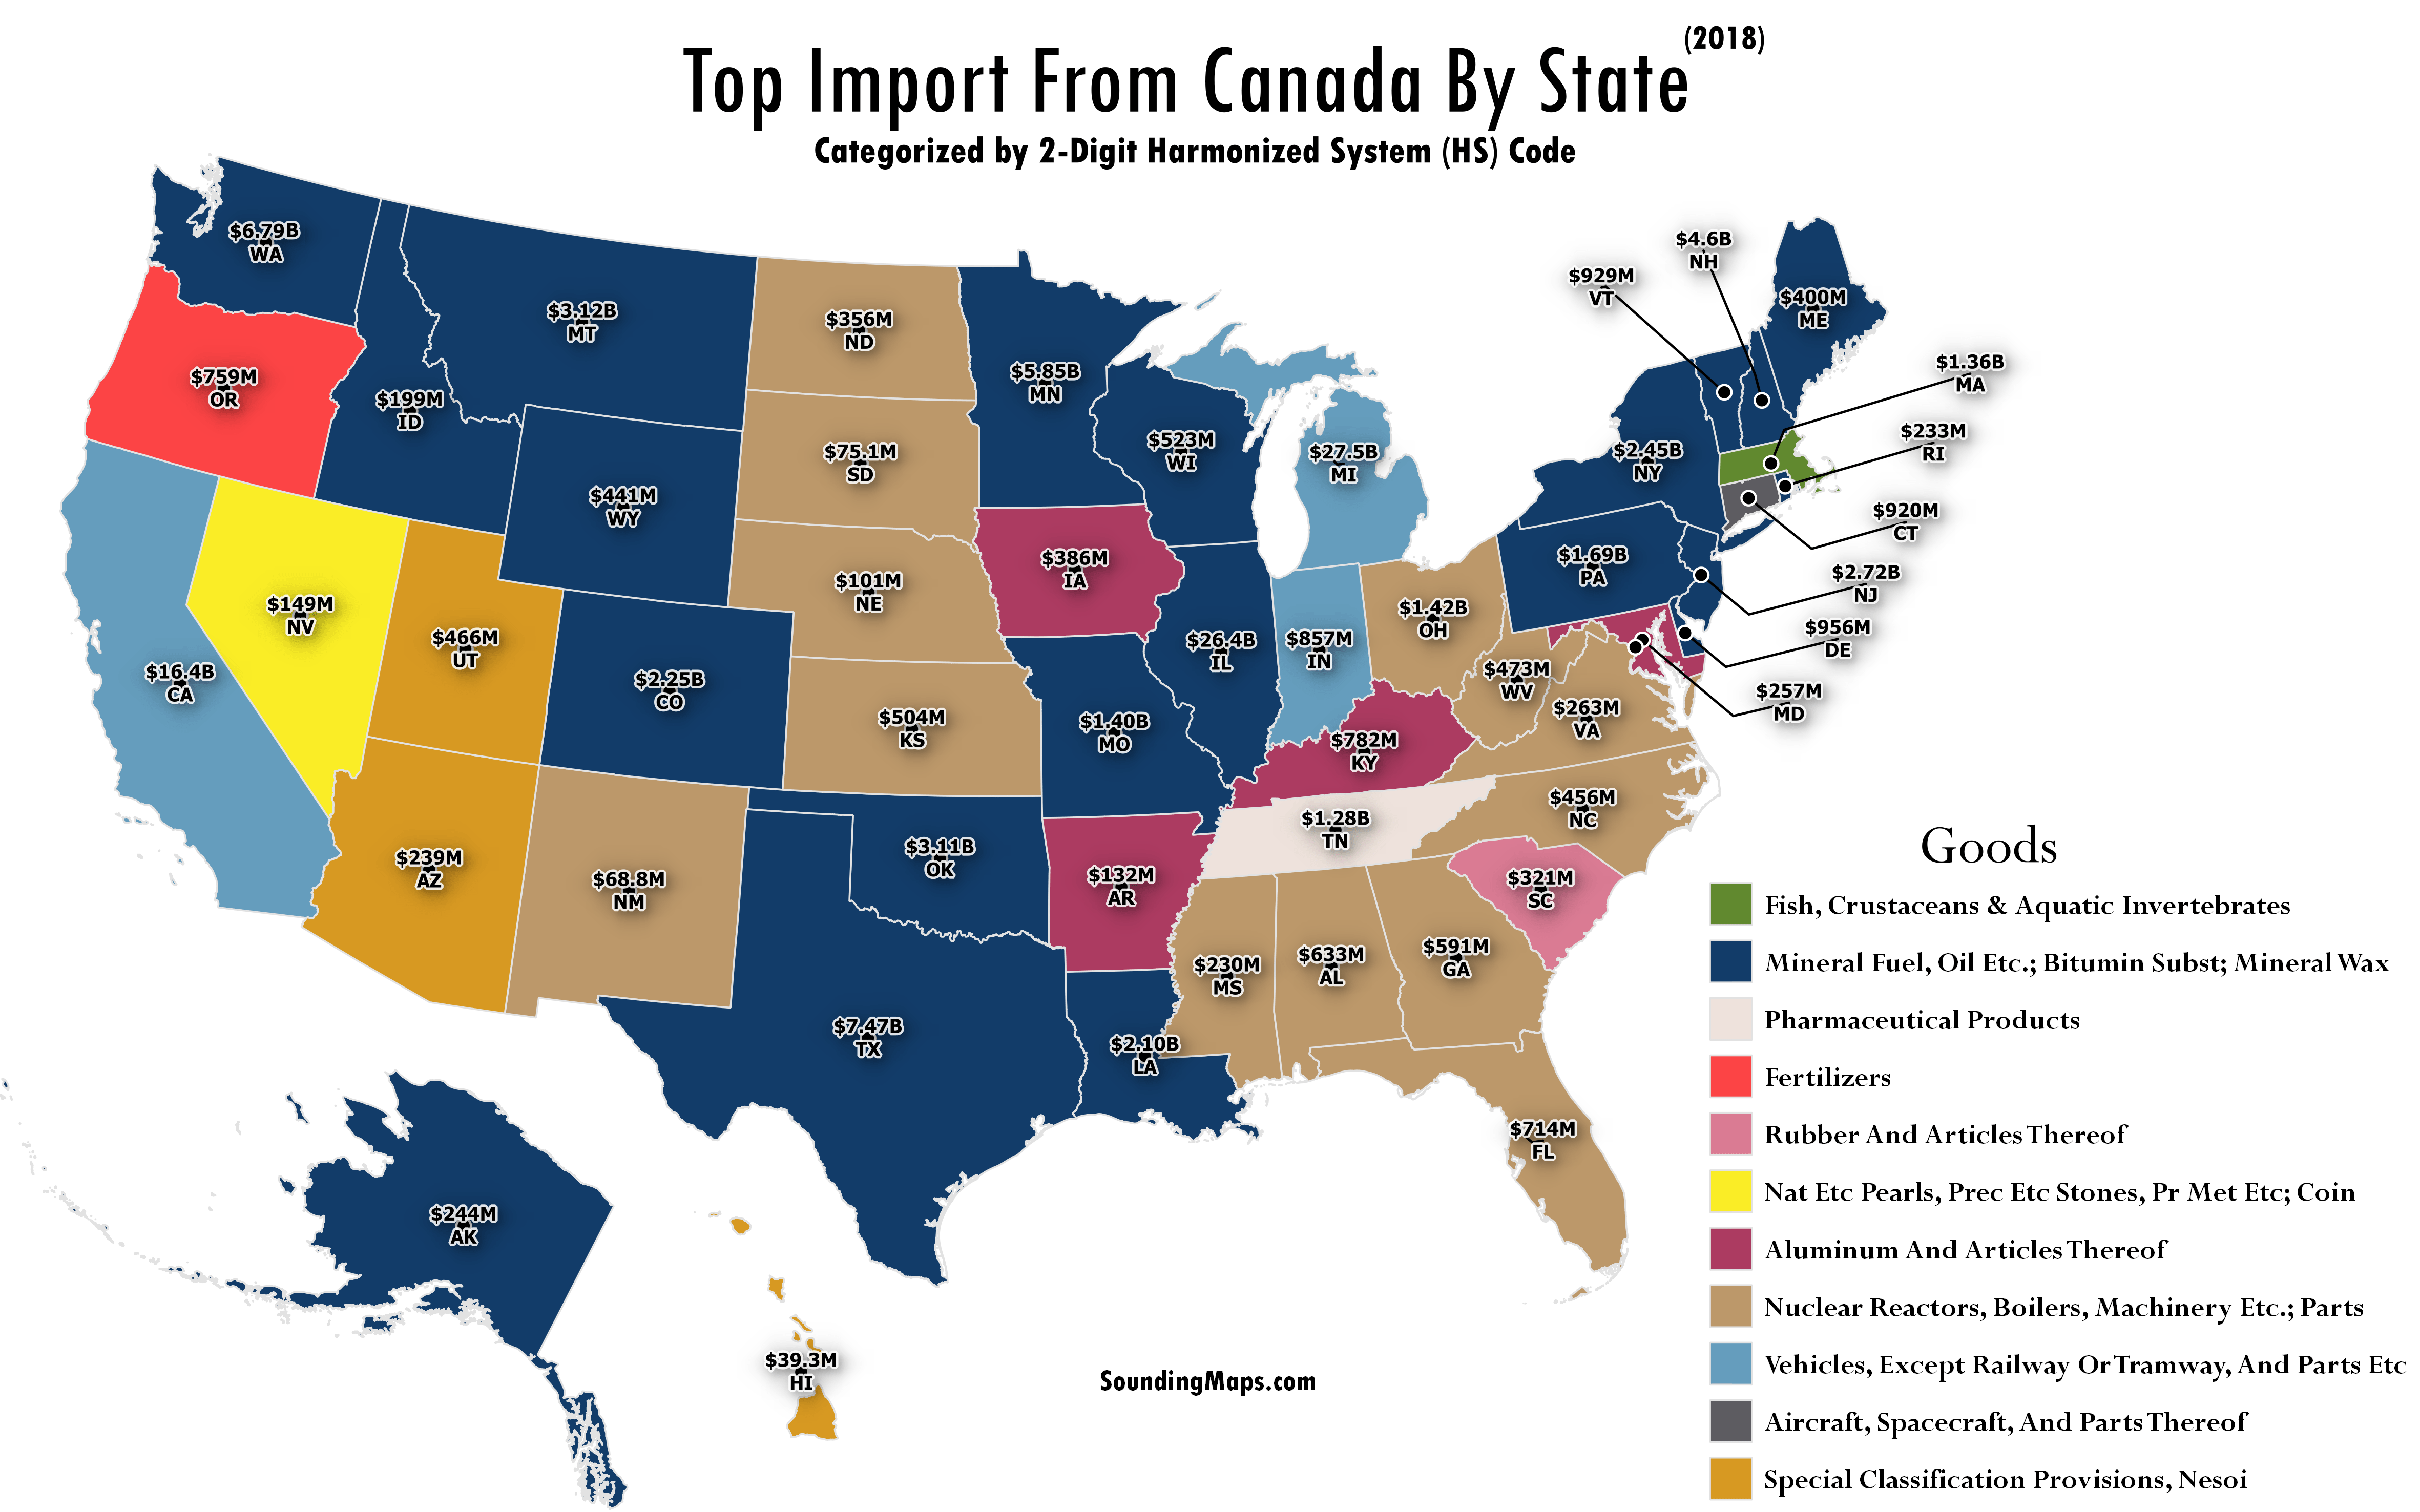
This map visualizes key US Imports from Canada categorized by 2-Digit HS codes. The HS code is an international nomenclature for the classification of products. The goods shown are the top import to each state from Canada. US imports from Canada totaled $318.8 billion in 2018 resulting in an 11% […]
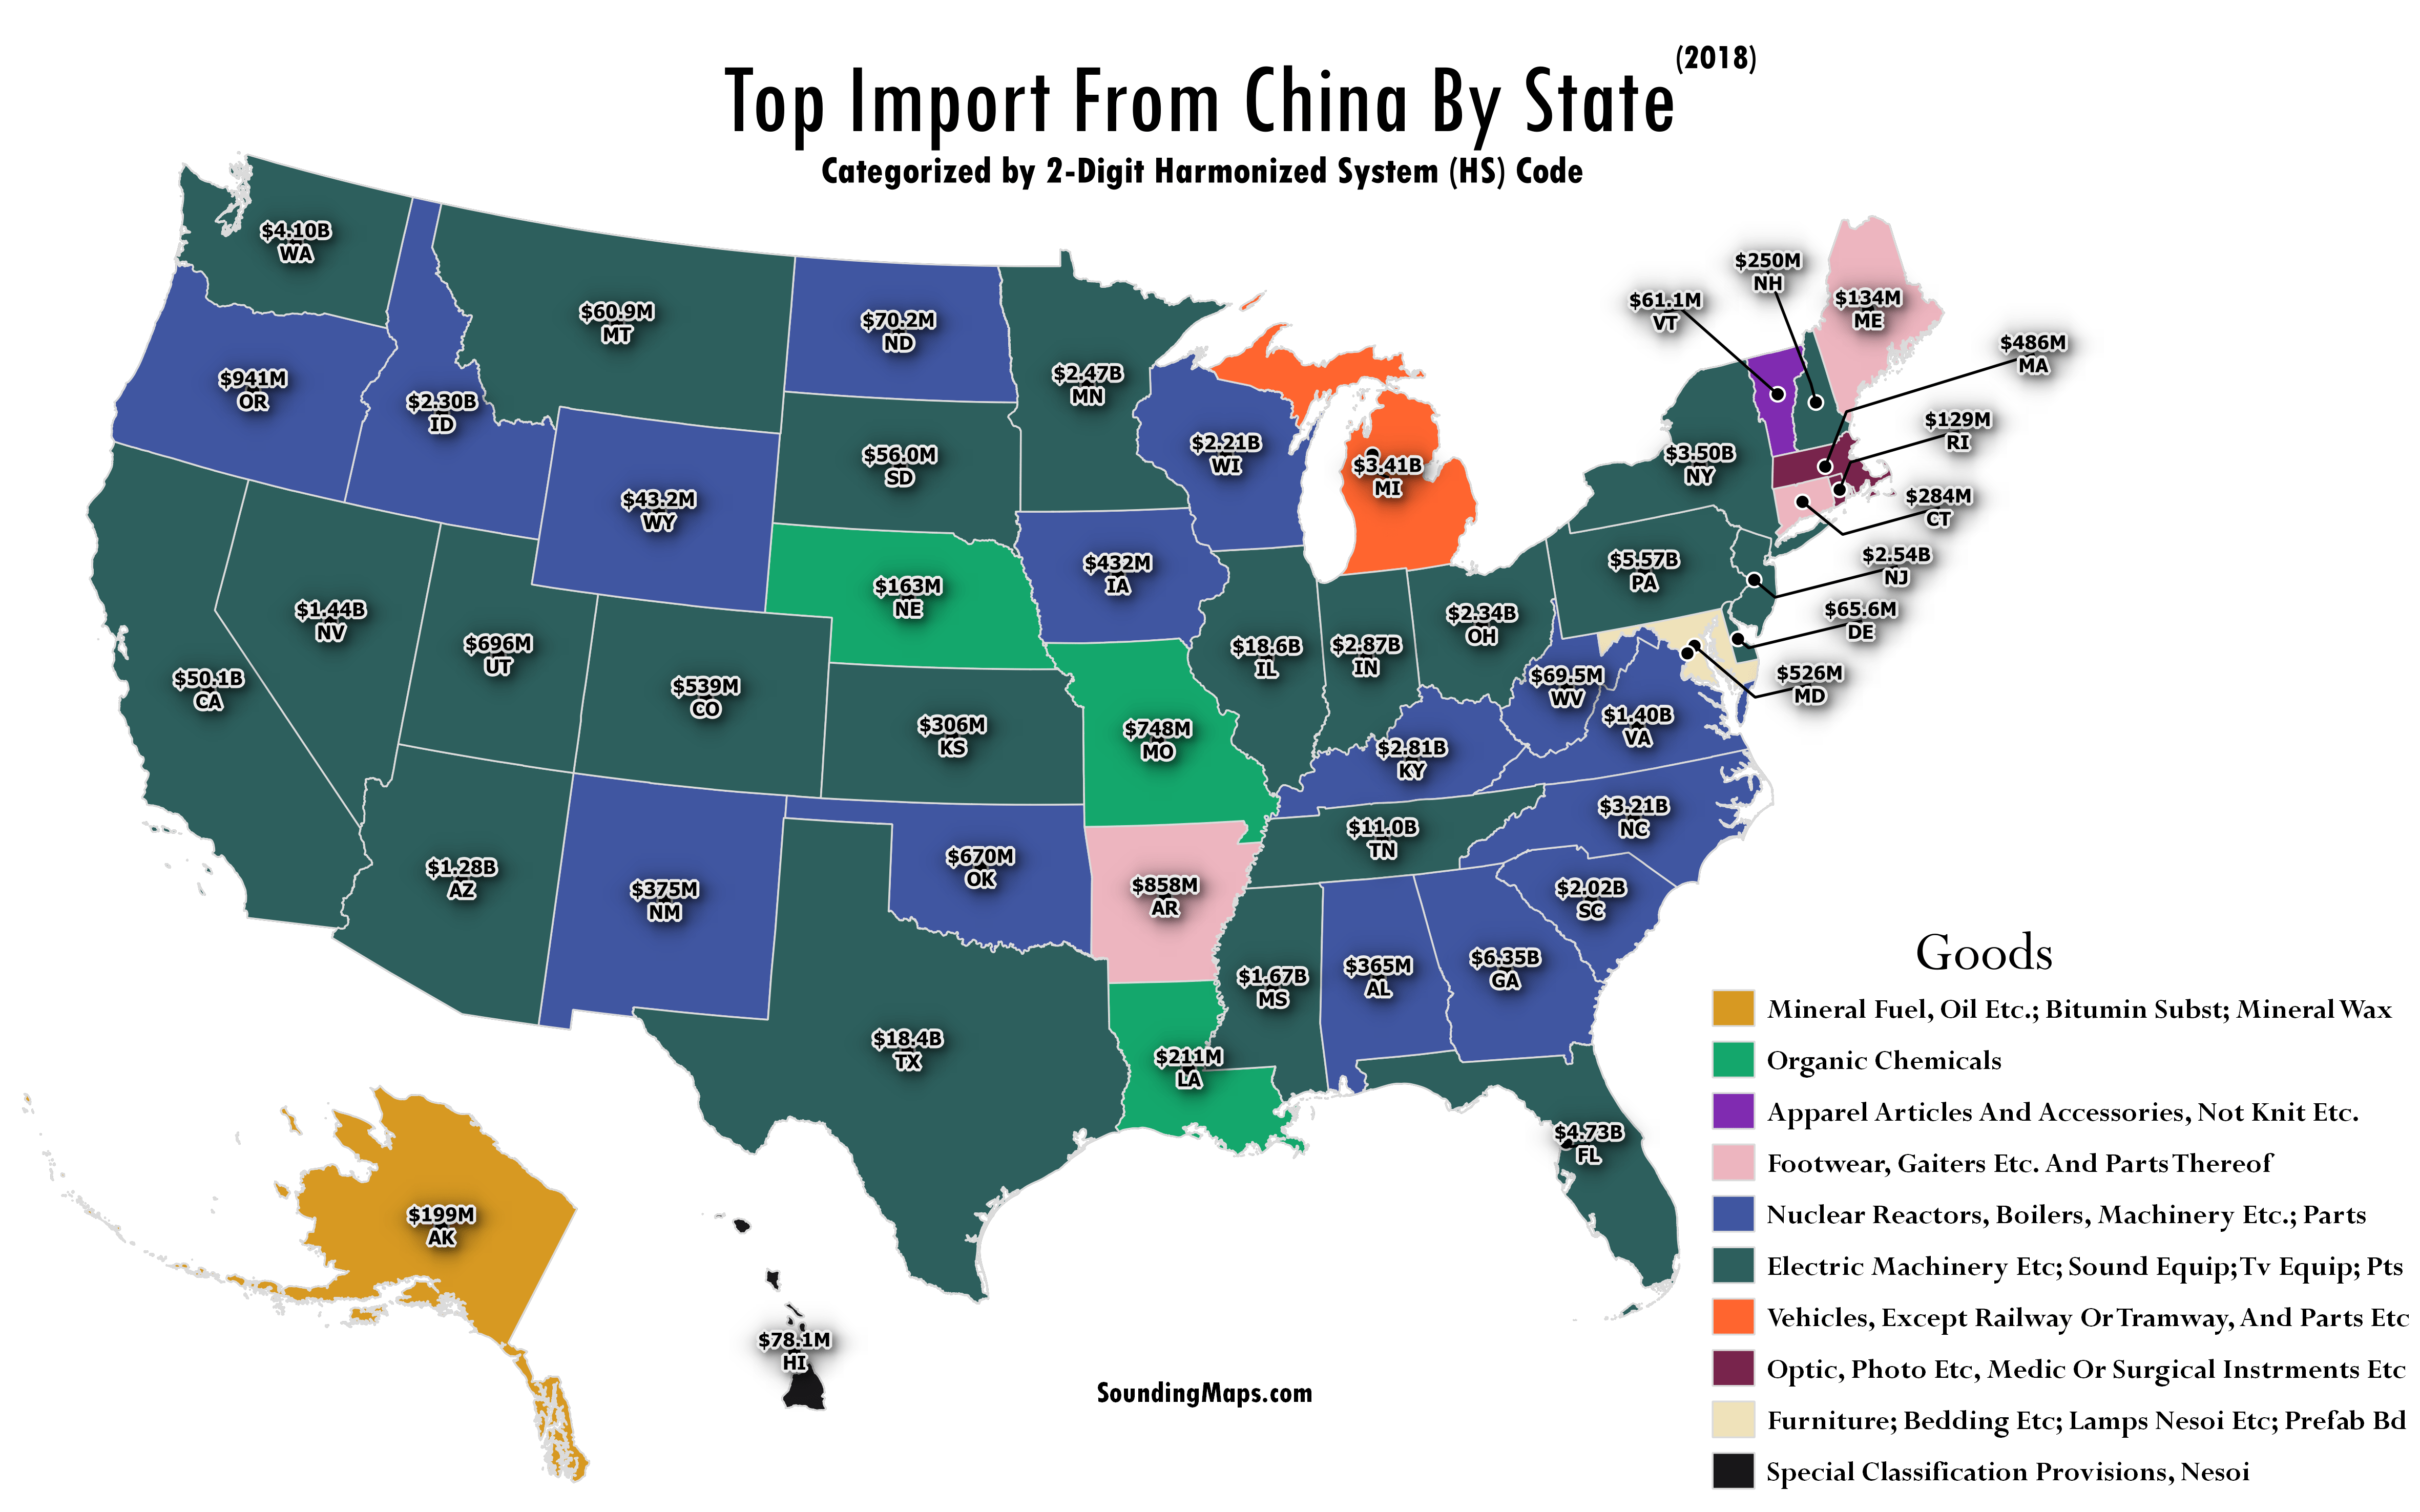
This map highlights the top imports to the United States from China for each state categorized by 2-Digit Harmonized System (HS) codes. The HS coding system is an internationally standardized system of names and numbers to classify trade products. Although using a 6 digit code will provide more insight into […]
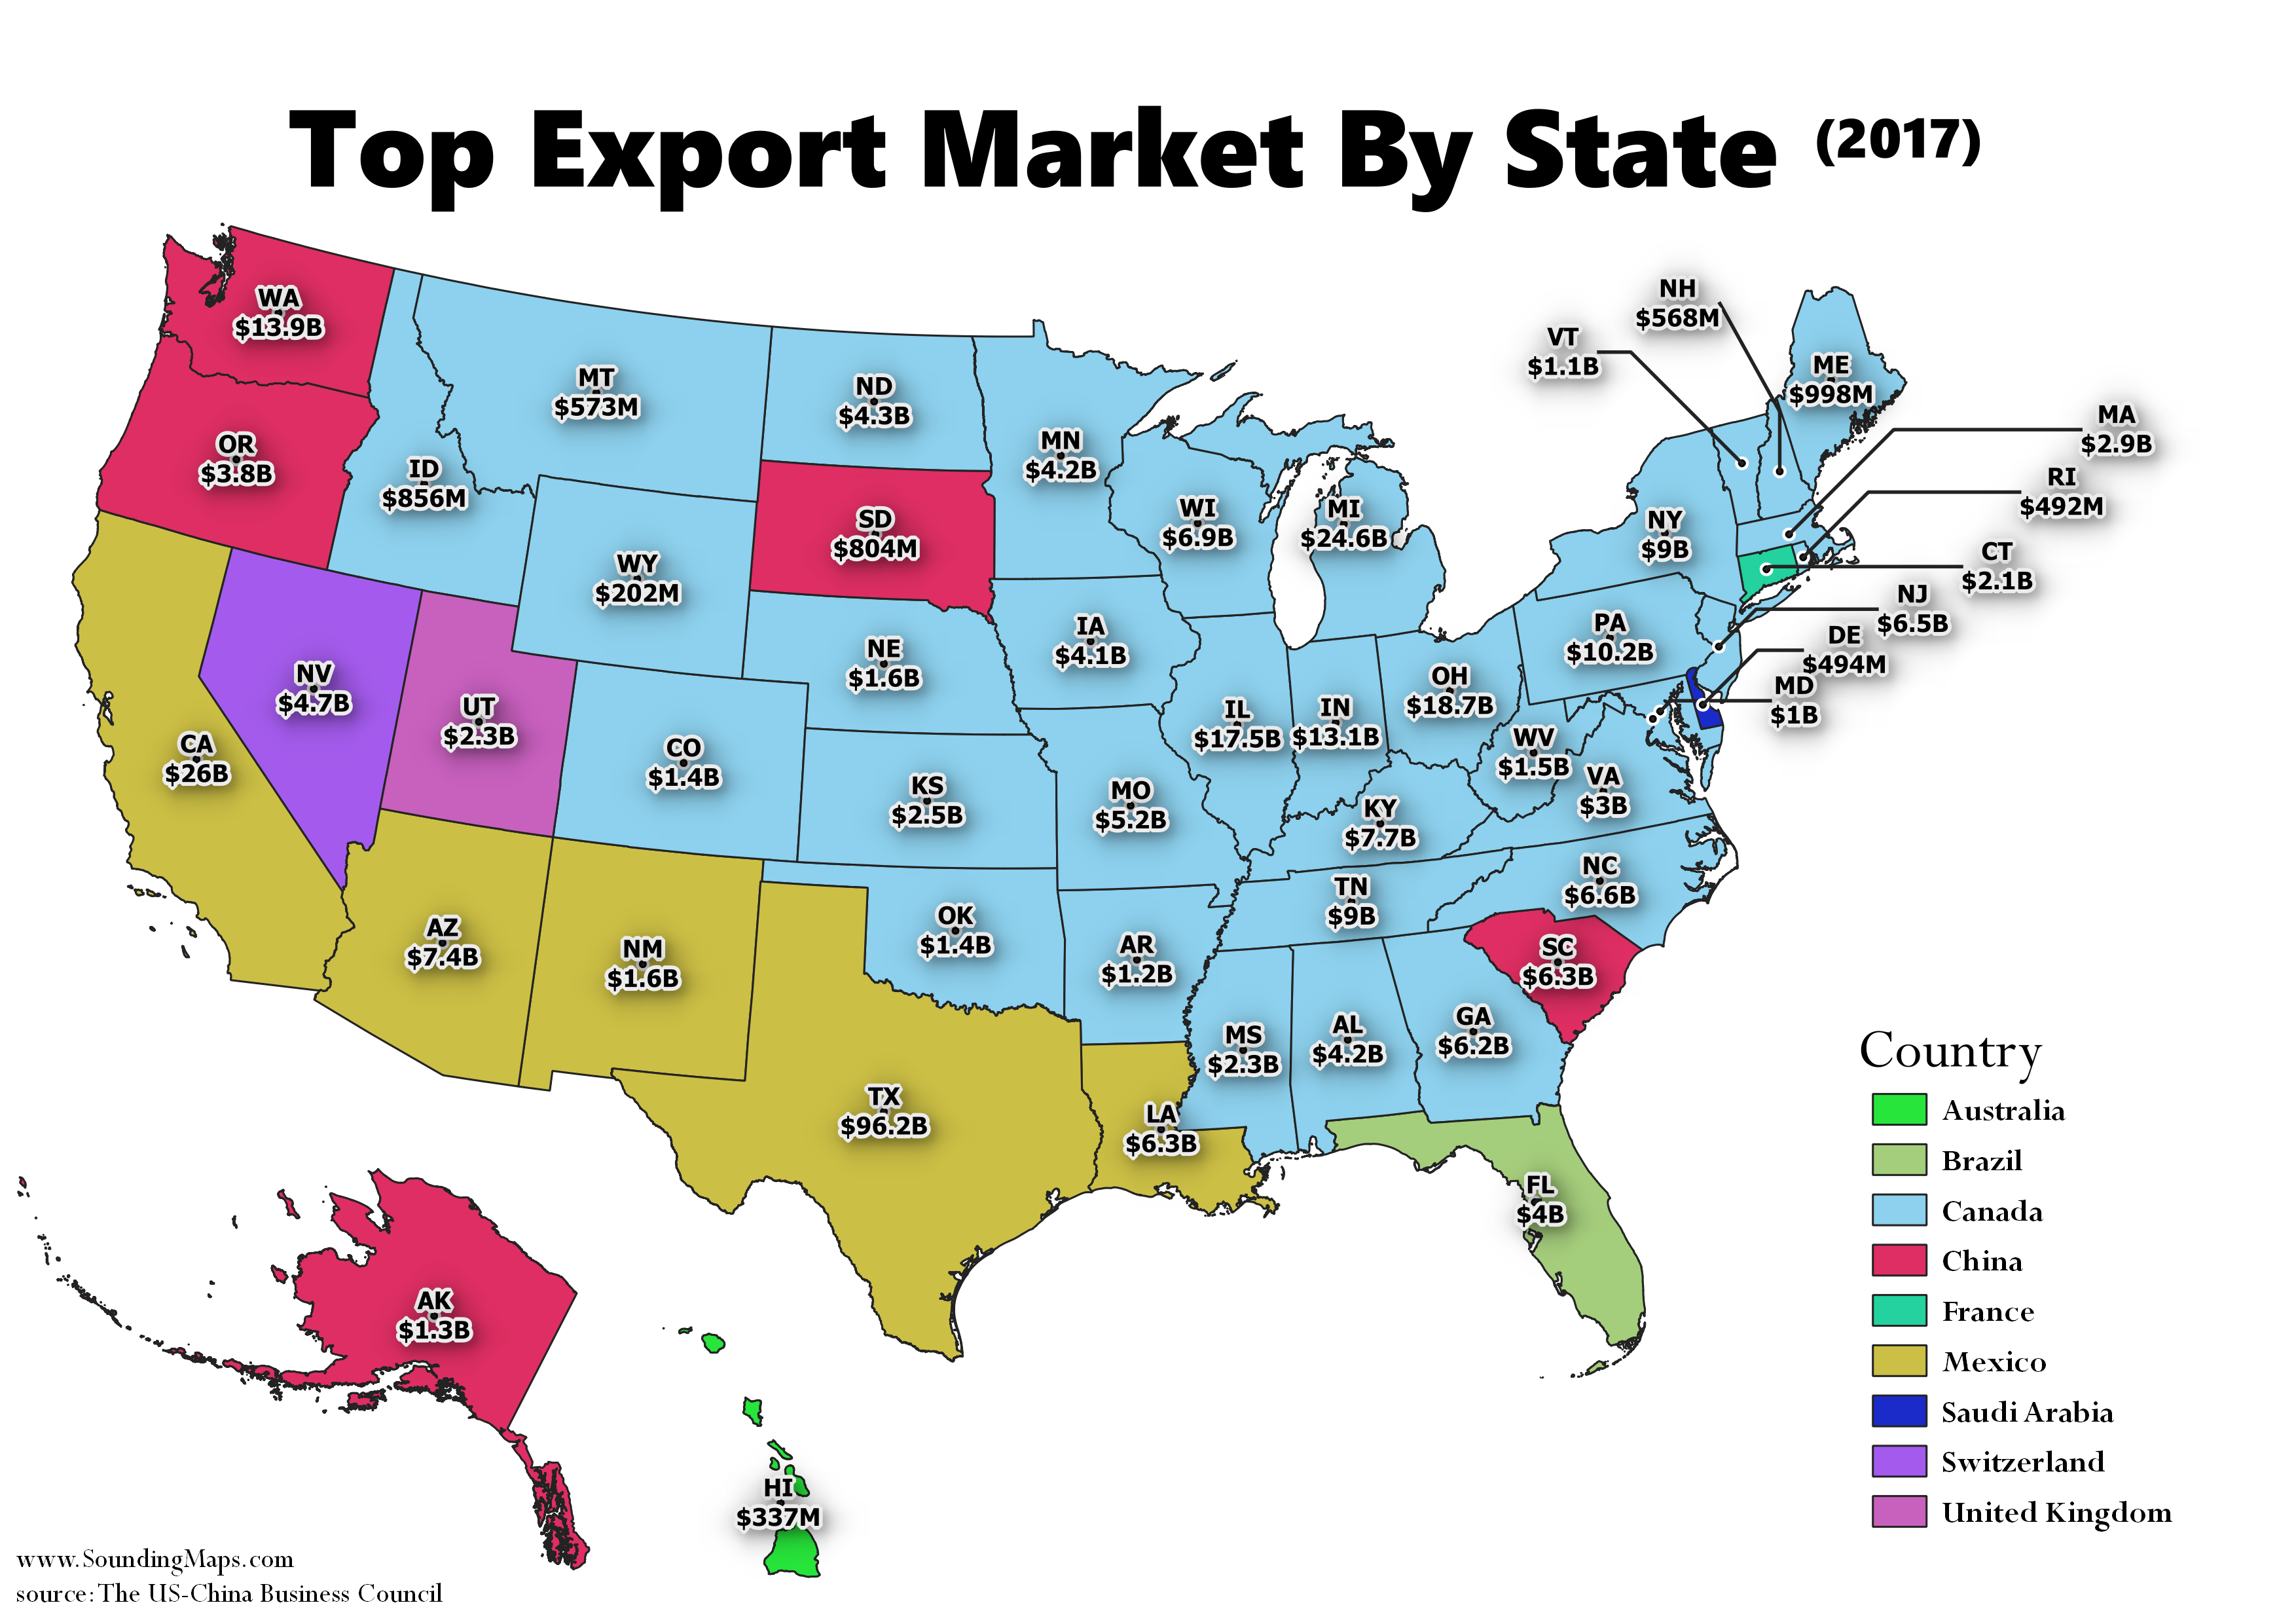
This map shows the United States biggest export markets for each state. In 2017, Canada was the United States biggest export market for 33 states, and exports to Canada across the country totaled $282.3 billion. Both China and Mexico are the top export market for 5 states. The top exports to […]

Now, categorized by operating revenue, this is the 2018 North American biggest railroads map. The USA rail network is dominated by 5 railroad companies. Read below to see how the 2022 railroad revenue’s compared. The Largest US Railroads Union Pacific is mapped in pink throughout the western United States against […]
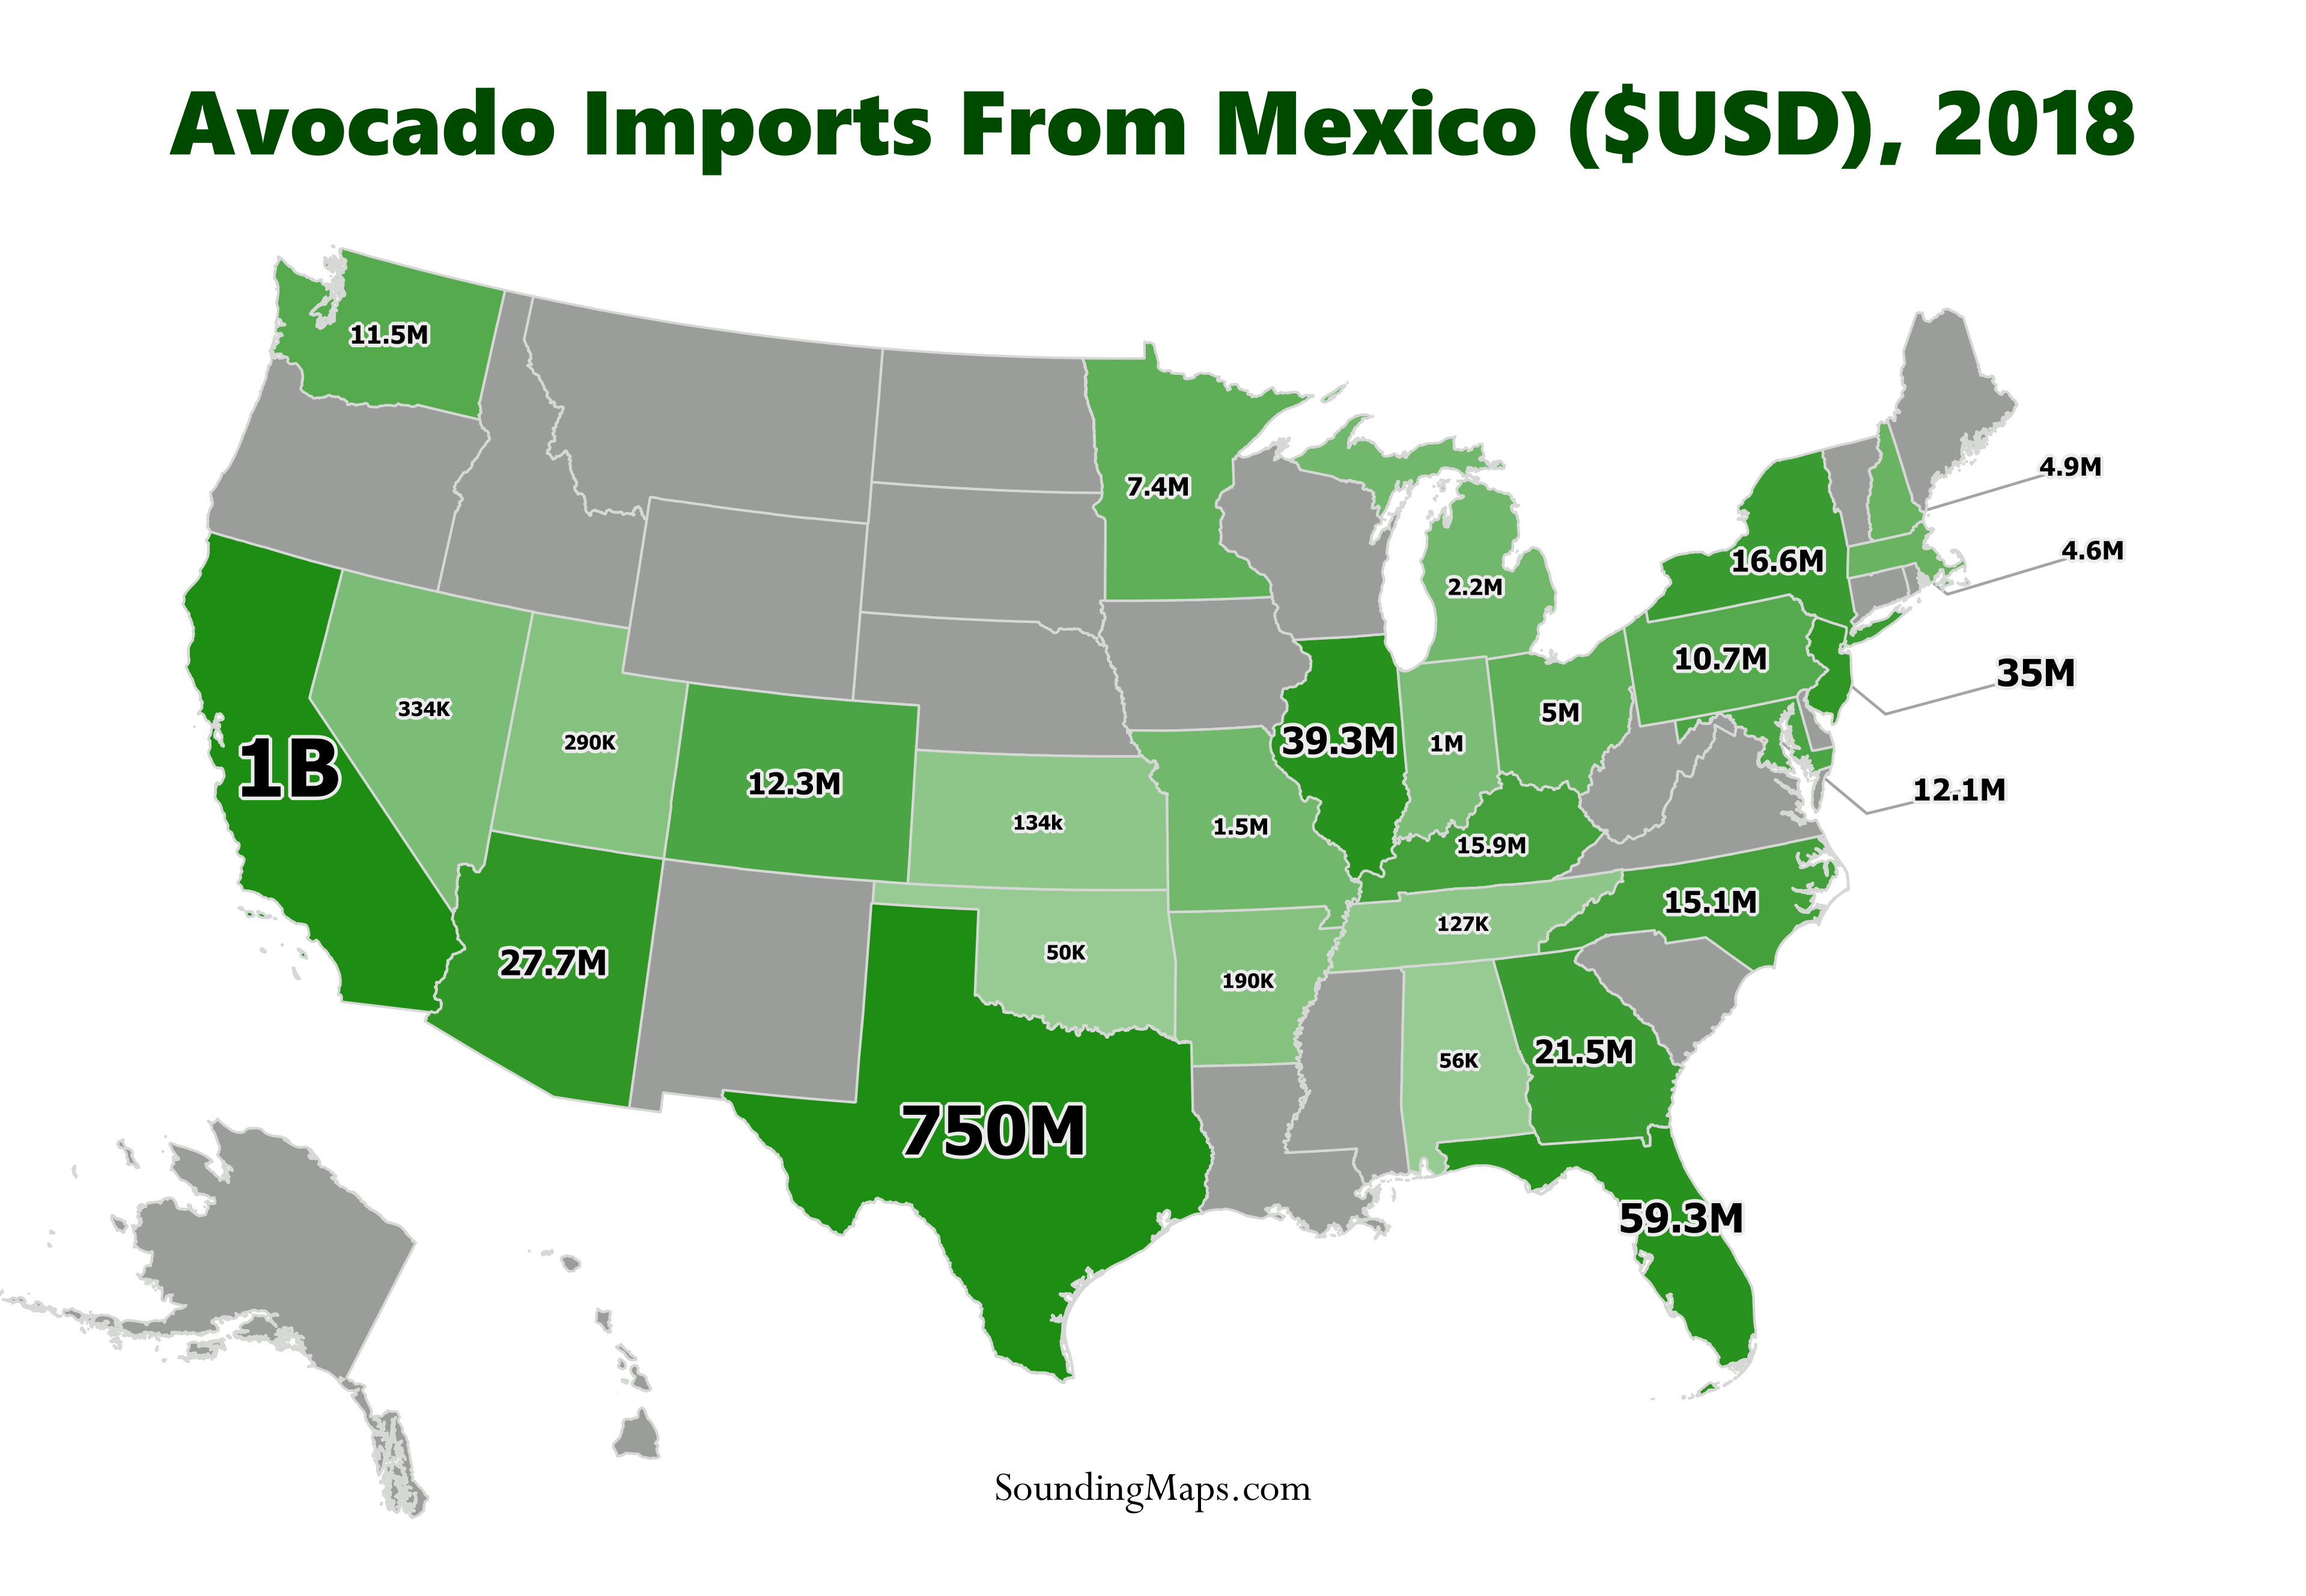
In light of Trump’s threats to close down the border and his recent retaliation of extending his trade war by threatening to impose tariffs against Mexico, this map demonstrates the impact of US avocado imports against Mexico. In 2018, the avocado imports from Mexico generated the country approximately $3 billion. […]
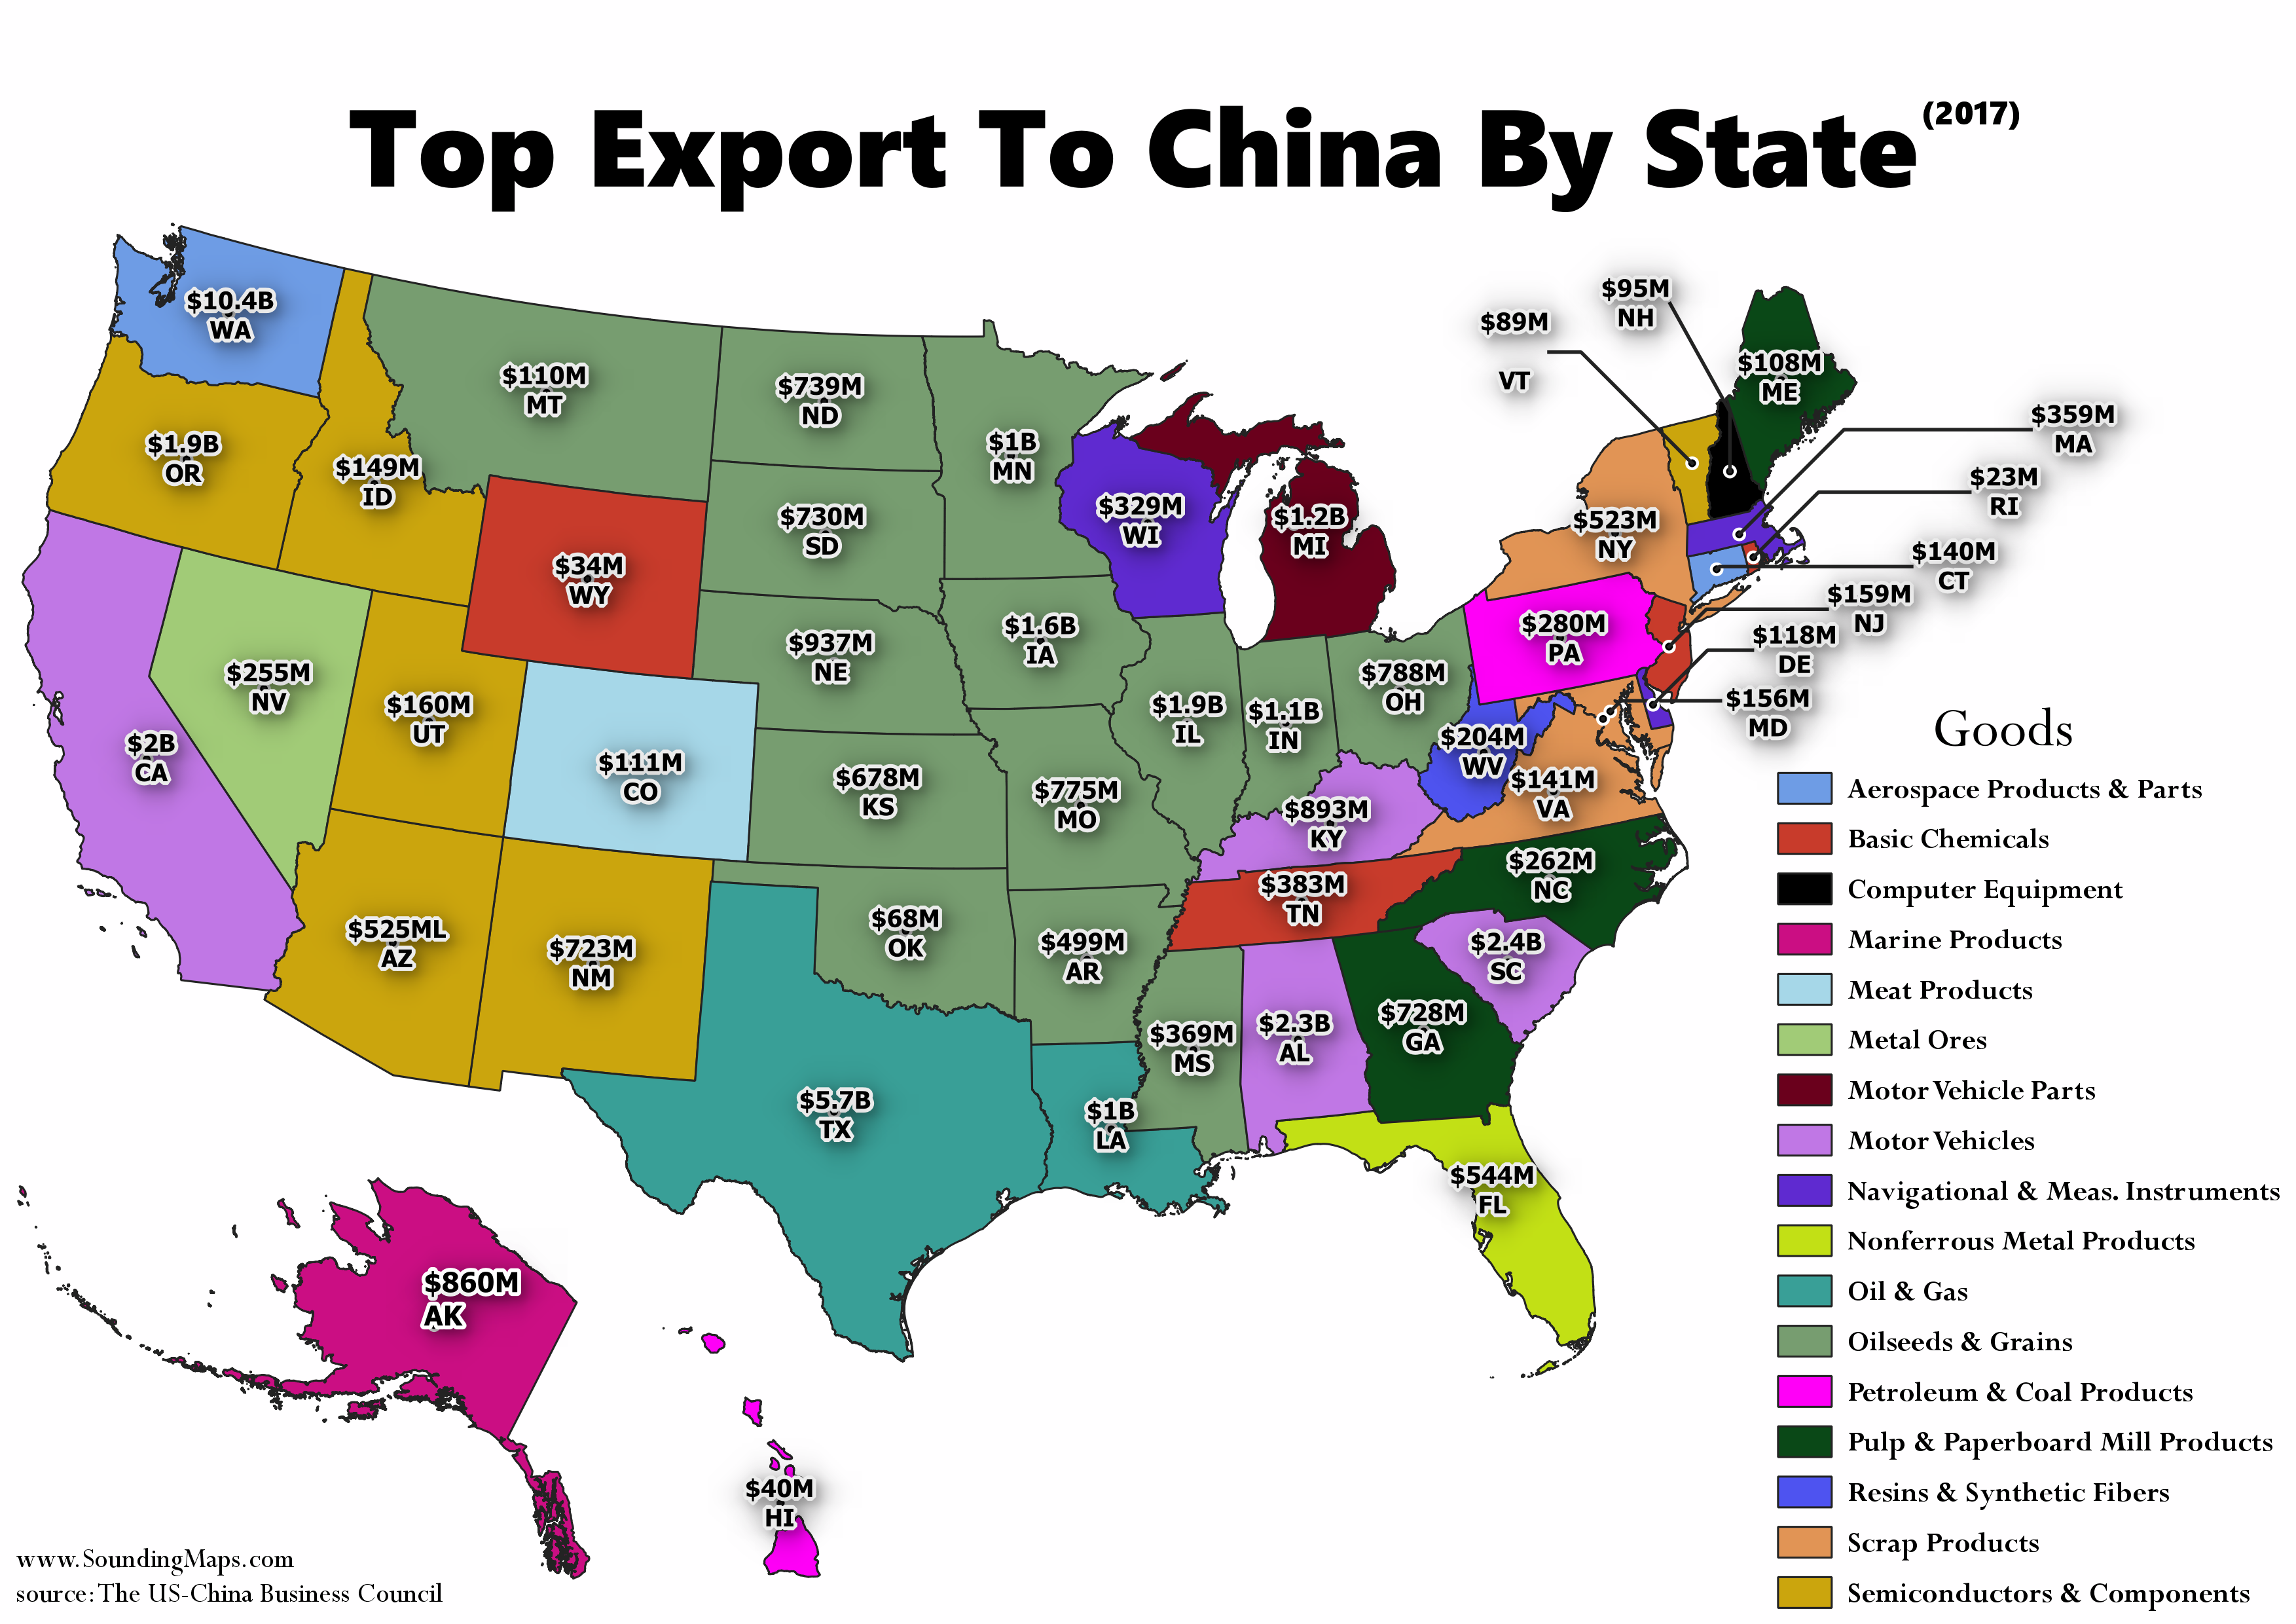
United States goods exports to China continue to outpace export growth to the rest of the world. In 2017, the United States exported more goods to China than ever before—more than $127 billion. The exports to China have grown by 86 percent over the last decade, while exports to the […]