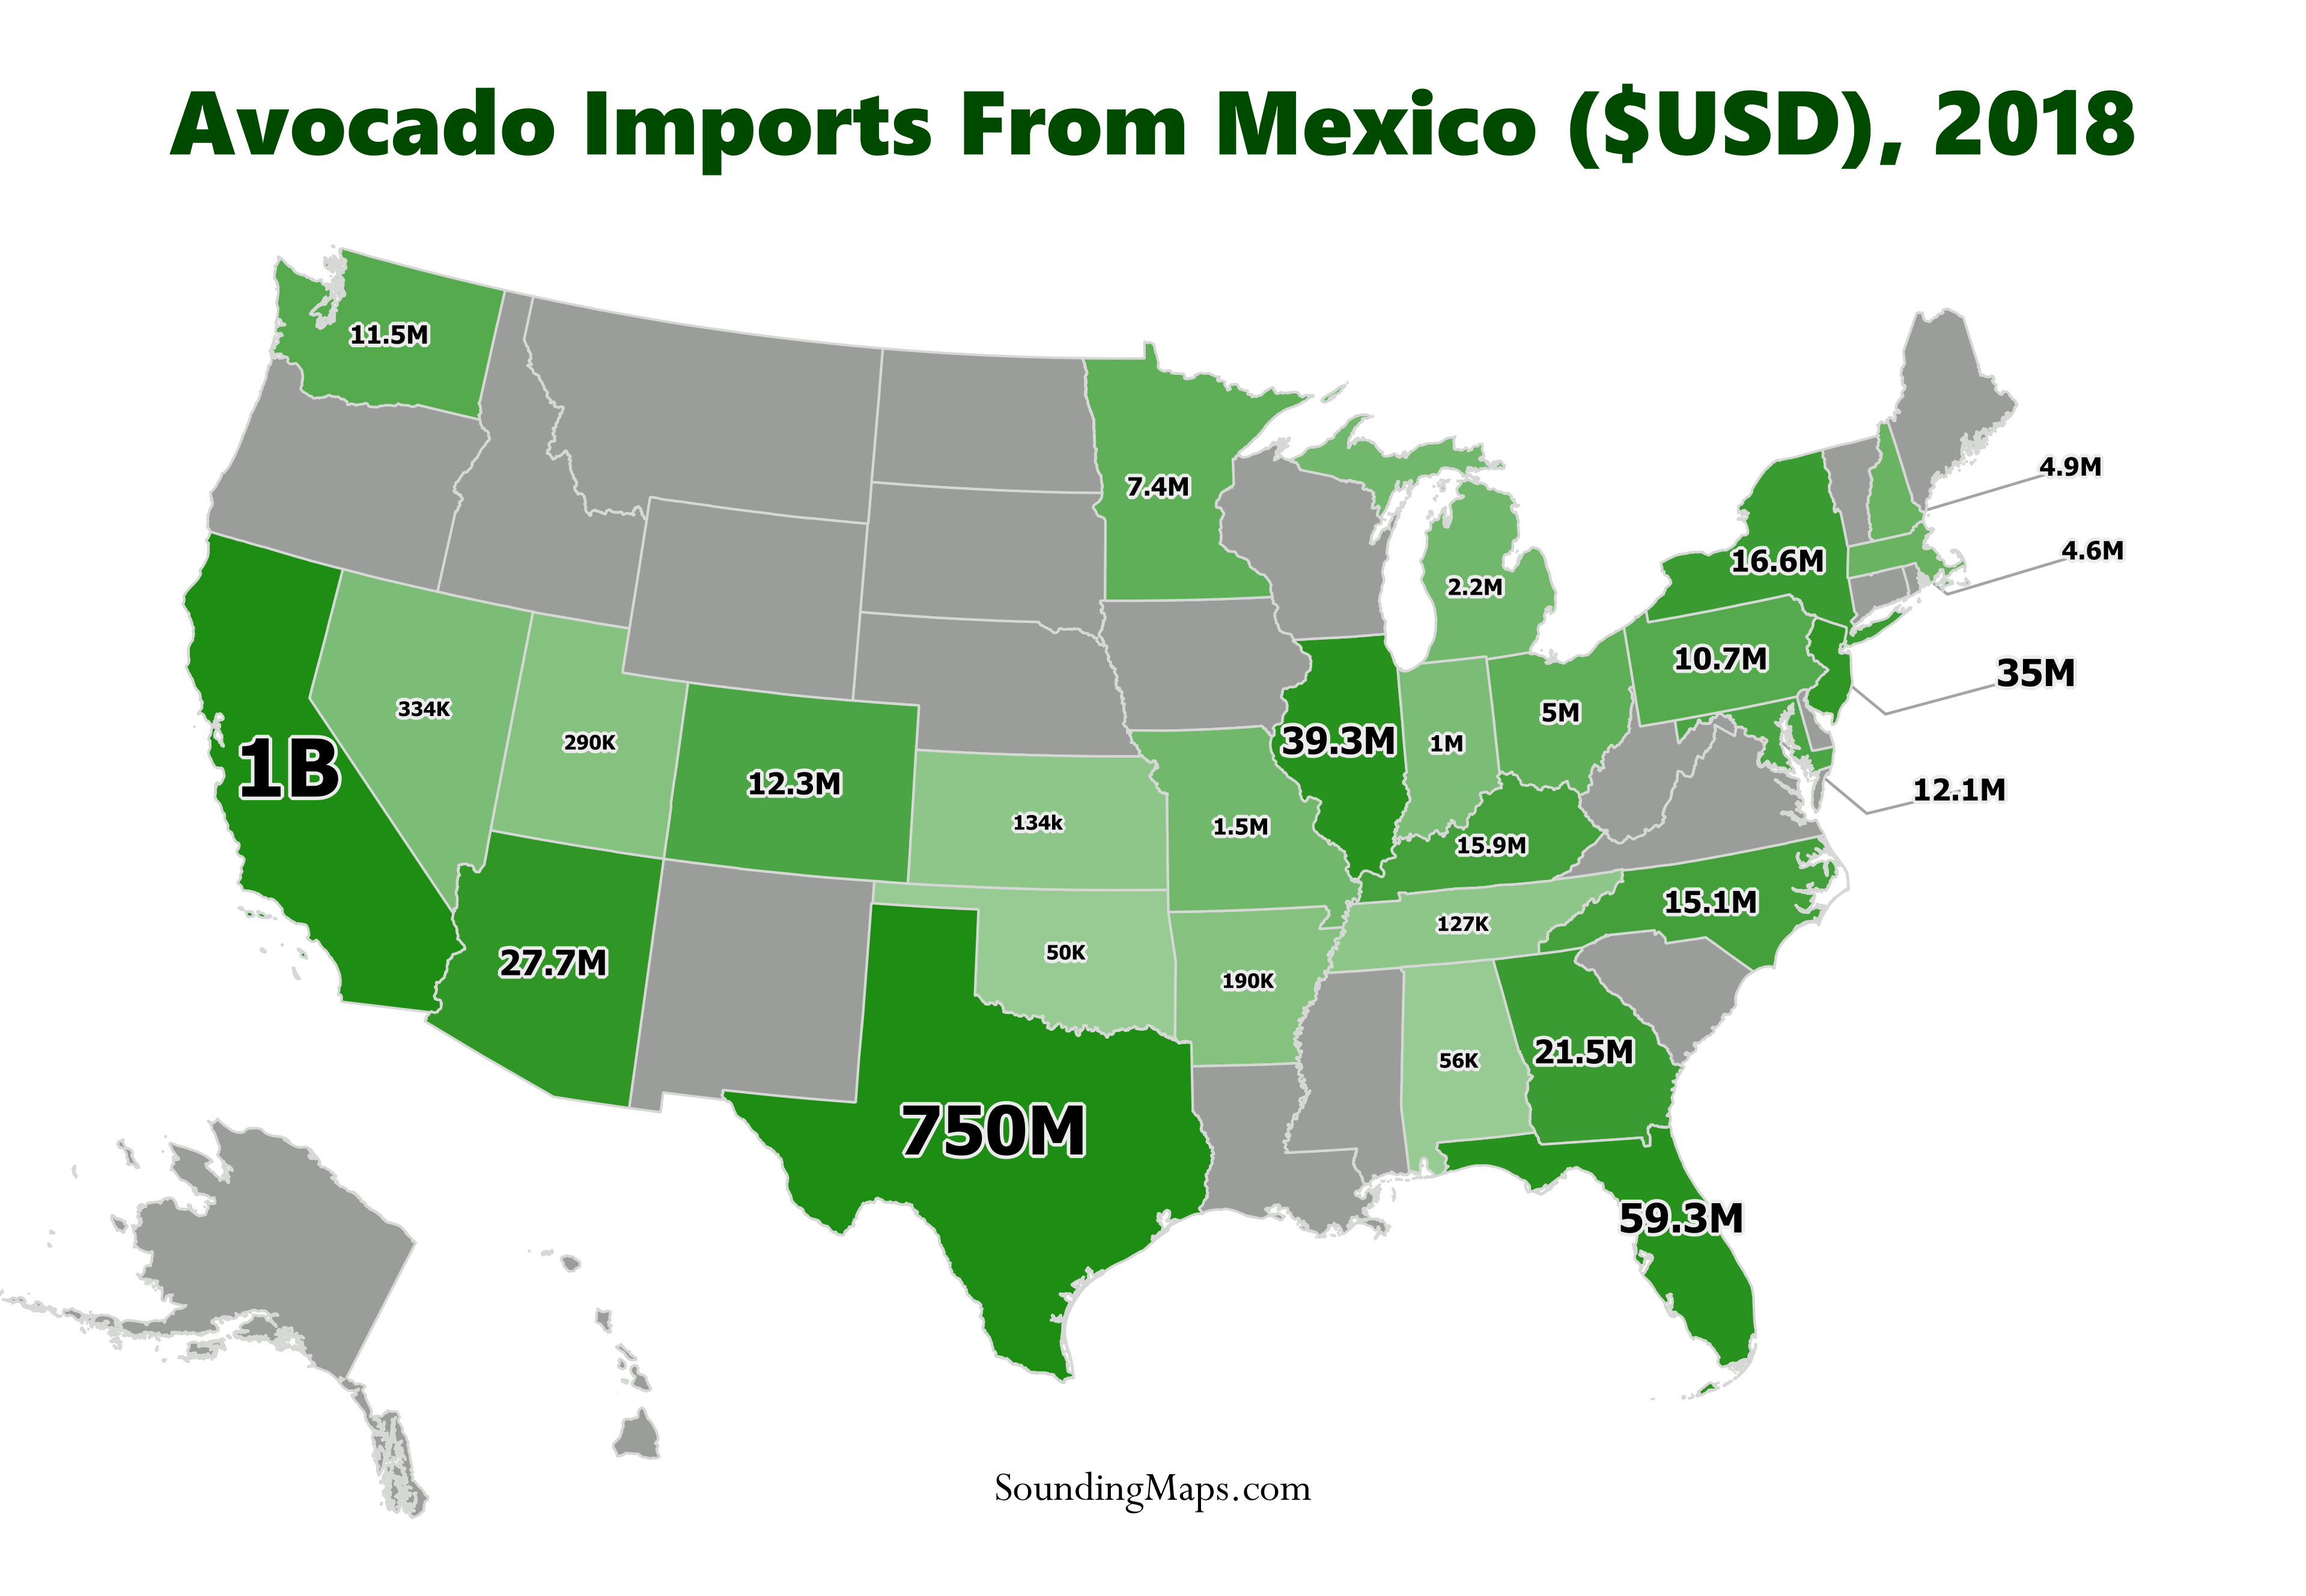
In light of Trump’s threats to close down the border and his recent retaliation of extending his trade war by threatening to impose tariffs against Mexico, this map demonstrates the impact of US avocado imports against Mexico. In 2018, the avocado imports from Mexico generated the country approximately $3 billion. Mexico exports the highest dollar value worth of this commodity in the world and it’s trading partner the United States is a big buyer. These numbers (in $USD) represent fresh or dried avocado’s.
The USDA said Mexico accounted for 87% of the total volume and 88% of the total value of U.S. avocado imports in 2018.
- California – $1,015,573,063
- Texas – $750,885,794
- Florida – $59,344,941
- Illinois – $39,297,367
- New Jersey – $35,281,556
Updated for 2019**
- California – $1,198,221,412
- Texas – $874,763,157
- Florida – $86,839,341
- New Jersey – $48,093,881
- Illinois – $43,679,036
Source: usatrade.census.gov, flexport.com/data/hs-code/080440-avocados-fresh-or-dried