
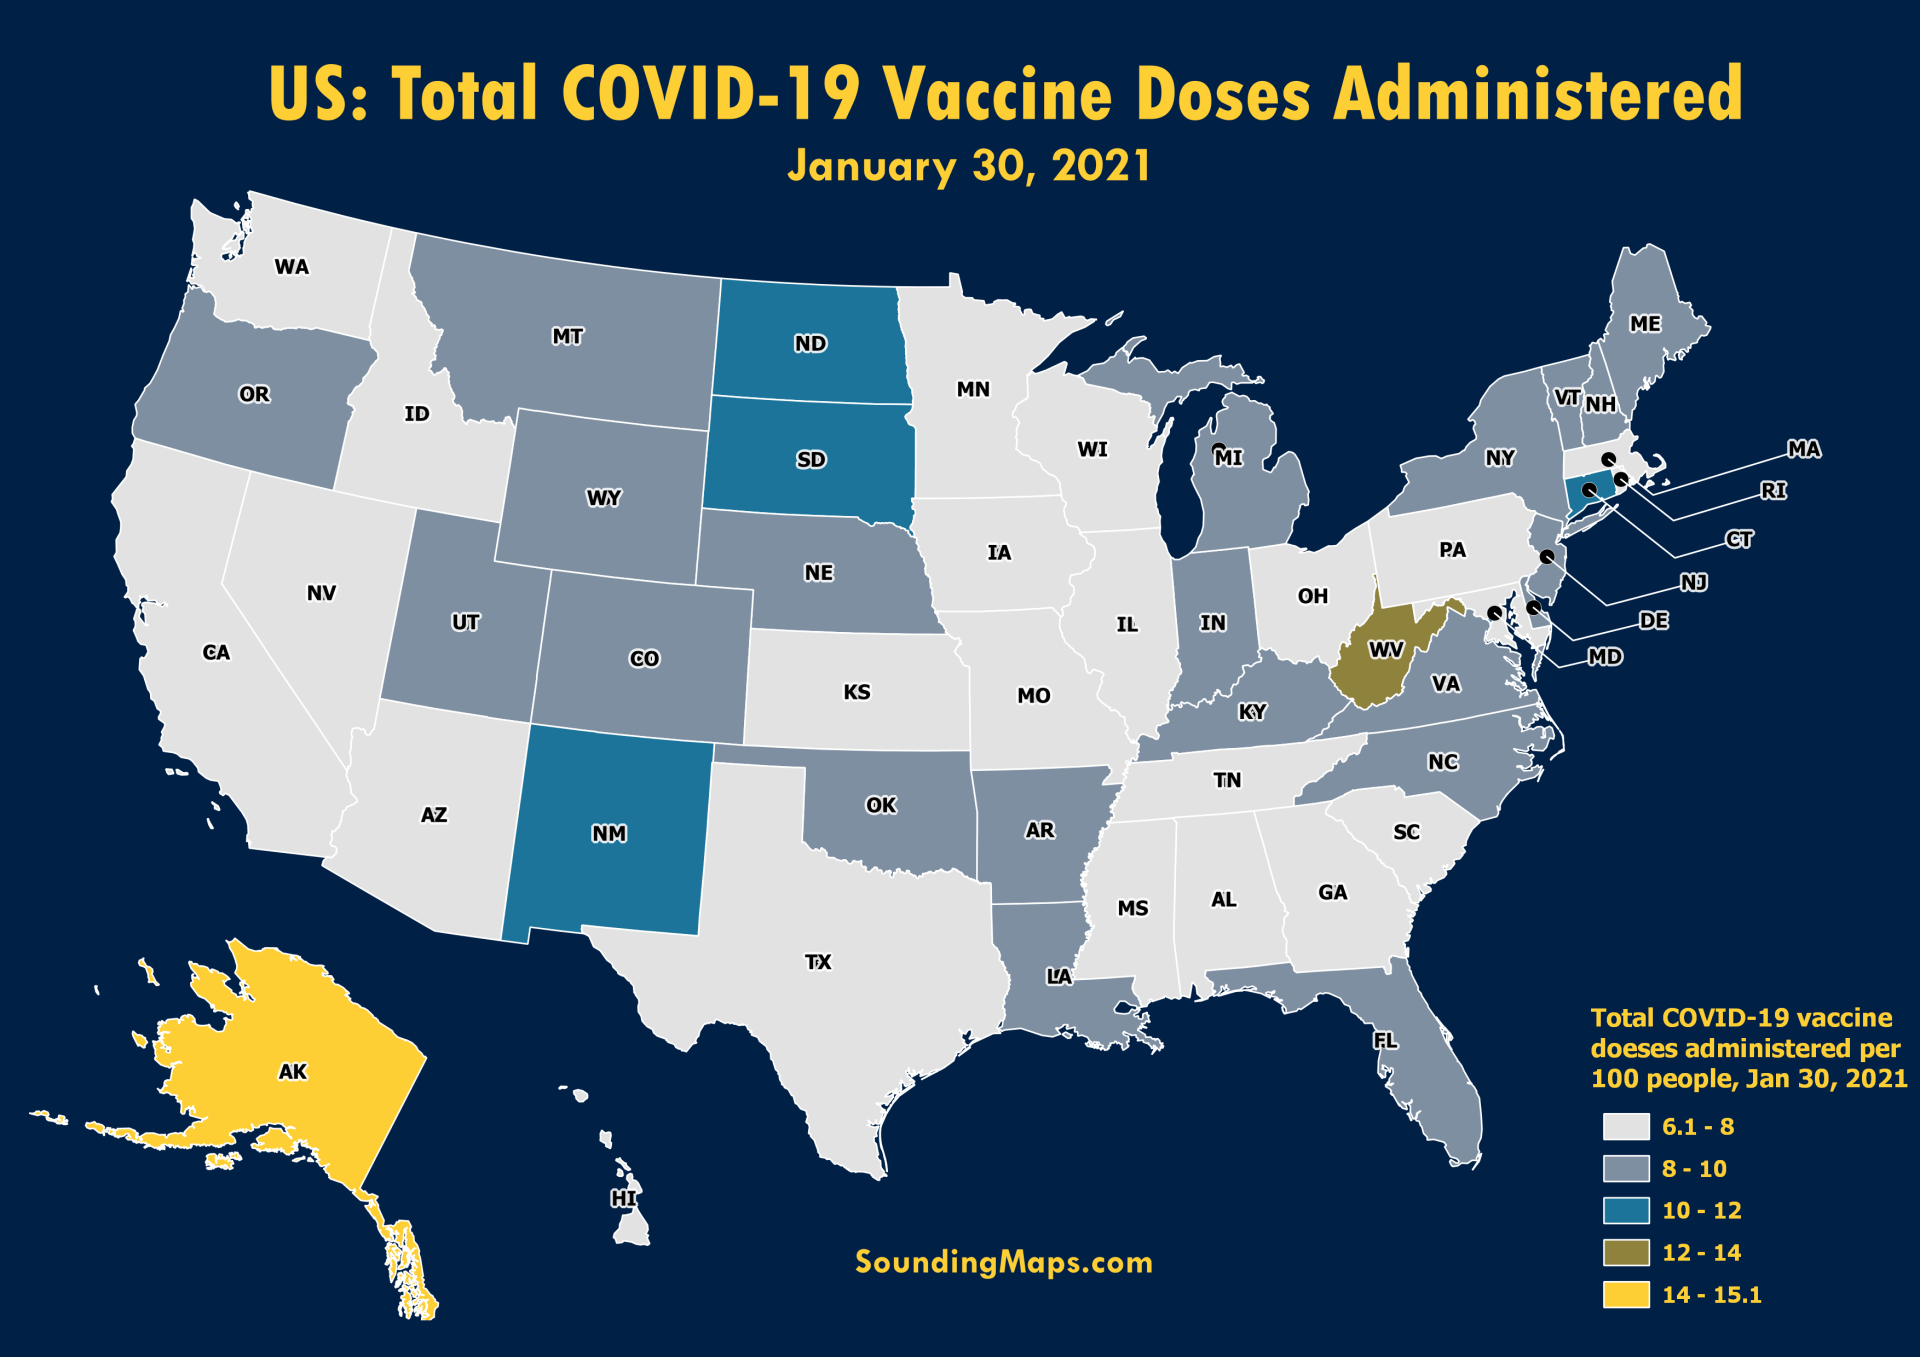
The United States COVID-19 vaccine dose map displayed above shows the states total number of COVID-19 vaccination doses administered per 100 people. The data used is counted as a single dose and may not equal the total number of people vaccinated. For example, one person may have received 3 doses per their dose regime but this counts as 3 individual doses administered per 100 people.
Alaska is front running the vaccine rollout with 15.09 doses administered per 100 people. West Virginia, New Mexico, North Dakota, and Connecticut, and South Dakota all are above 10 doses per 100 people. The worst performing state with vaccine rollouts are Idaho, Alabama, Kansas, Missouri, and Nevada.
As vaccine companies compete, different dose regimes will be determined for use across the United States. The FDA website does more into depth about the specifics. Here’s a snippet from their website.
For the Pfizer-BioNTech COVID-19 vaccine, the interval is 21 days between the first and second dose. And for the Moderna COVID-19 vaccine, the interval is 28 days between the first and second dose.
https://www.fda.gov/news-events/press-announcements/fda-statement-following-authorized-dosing-schedules-covid-19-vaccines
Source: https://covid.cdc.gov/covid-data-tracker/#vaccinations
One thought on “US: Total COVID-19 Vaccine Doses Administered”
California is lacking quality leadership it seems.