
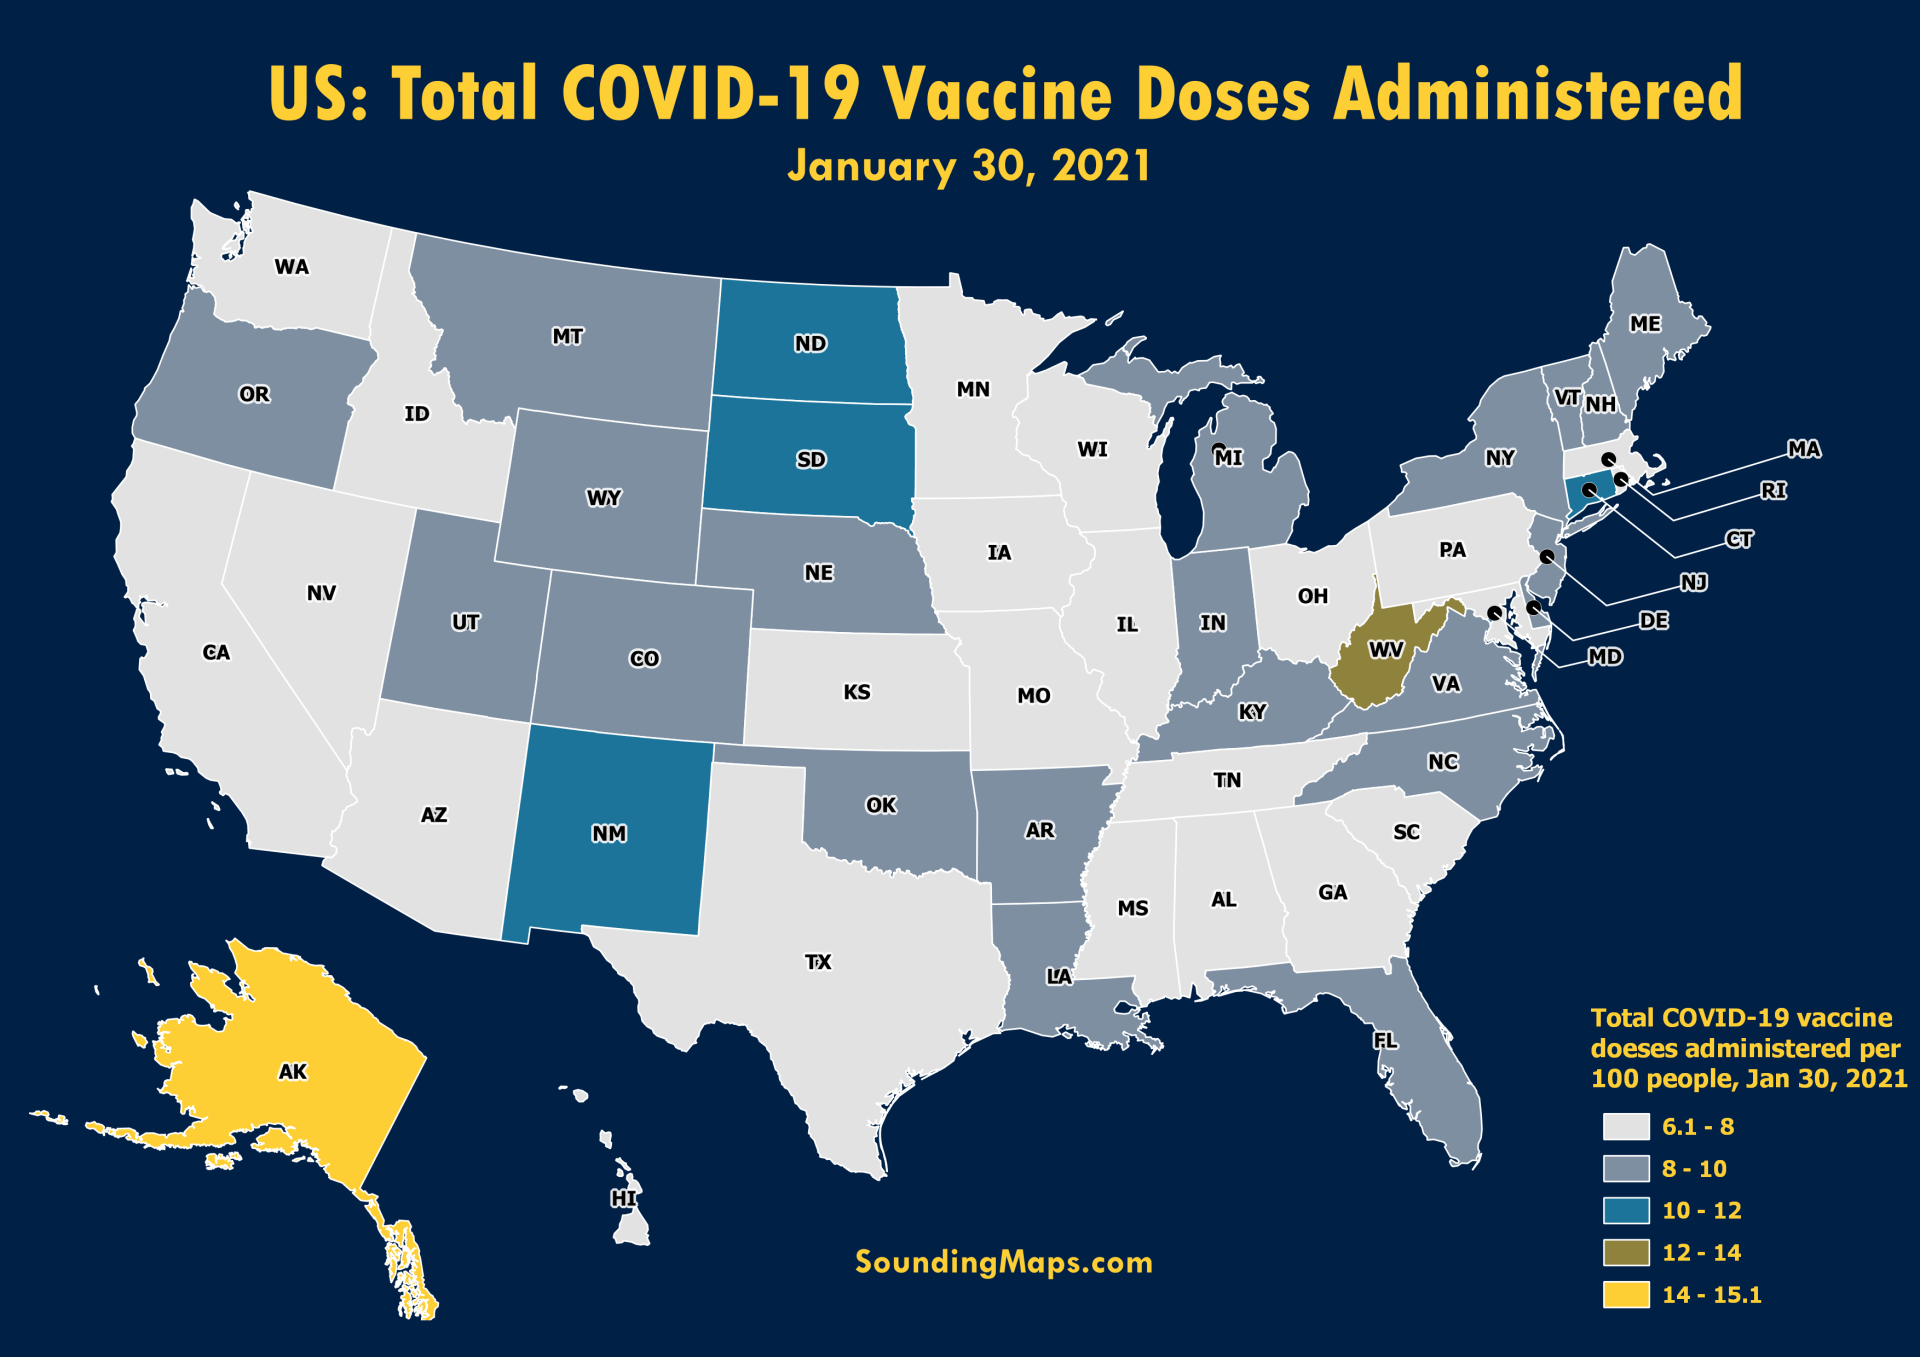
The United States COVID-19 vaccine dose map displayed above shows the states total number of COVID-19 vaccination doses administered per 100 people. The data used is counted as a single dose and may not equal the total number of people vaccinated. For example, one person may have received 3 doses […]
Health
4 posts
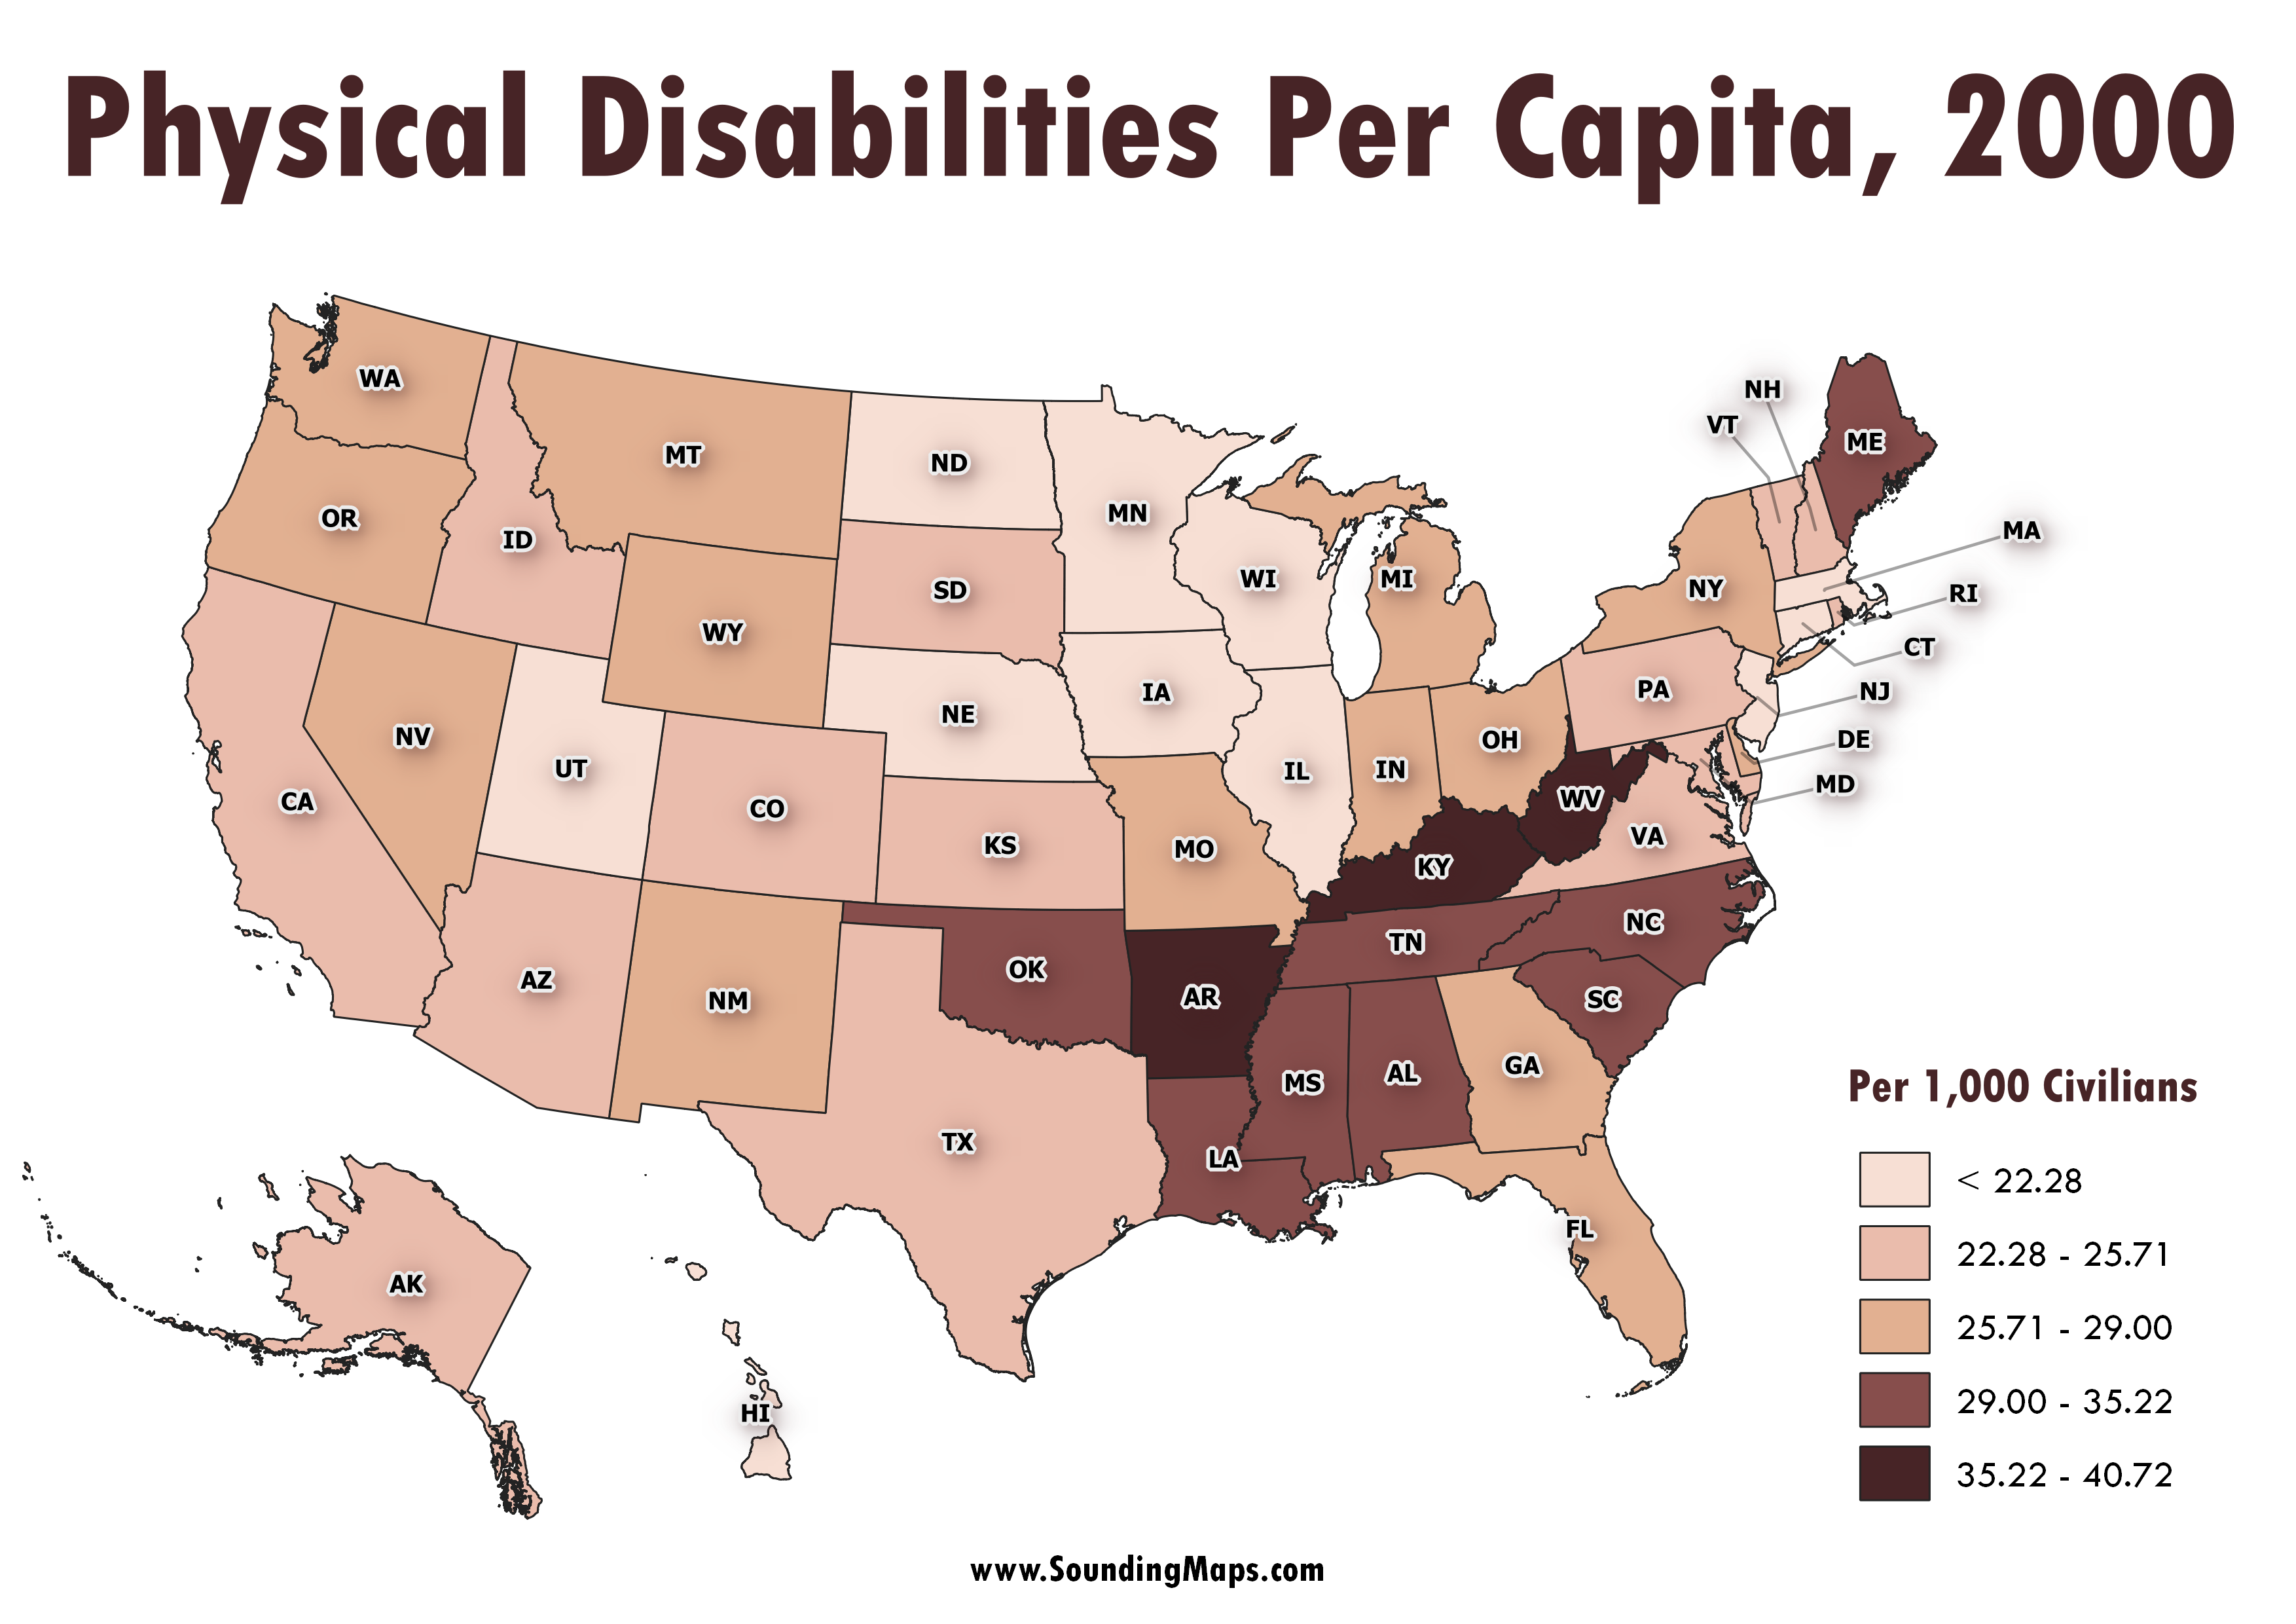
Physical disabilities USA! This map reveals the cluster of states with high rates of physical disabilities measured per capita. Turns out, the concentration take holds in the South Eastern United States. Census 2000, marking the turn of the millennia, surveyed disability status’ of Americans. The total count of a person […]
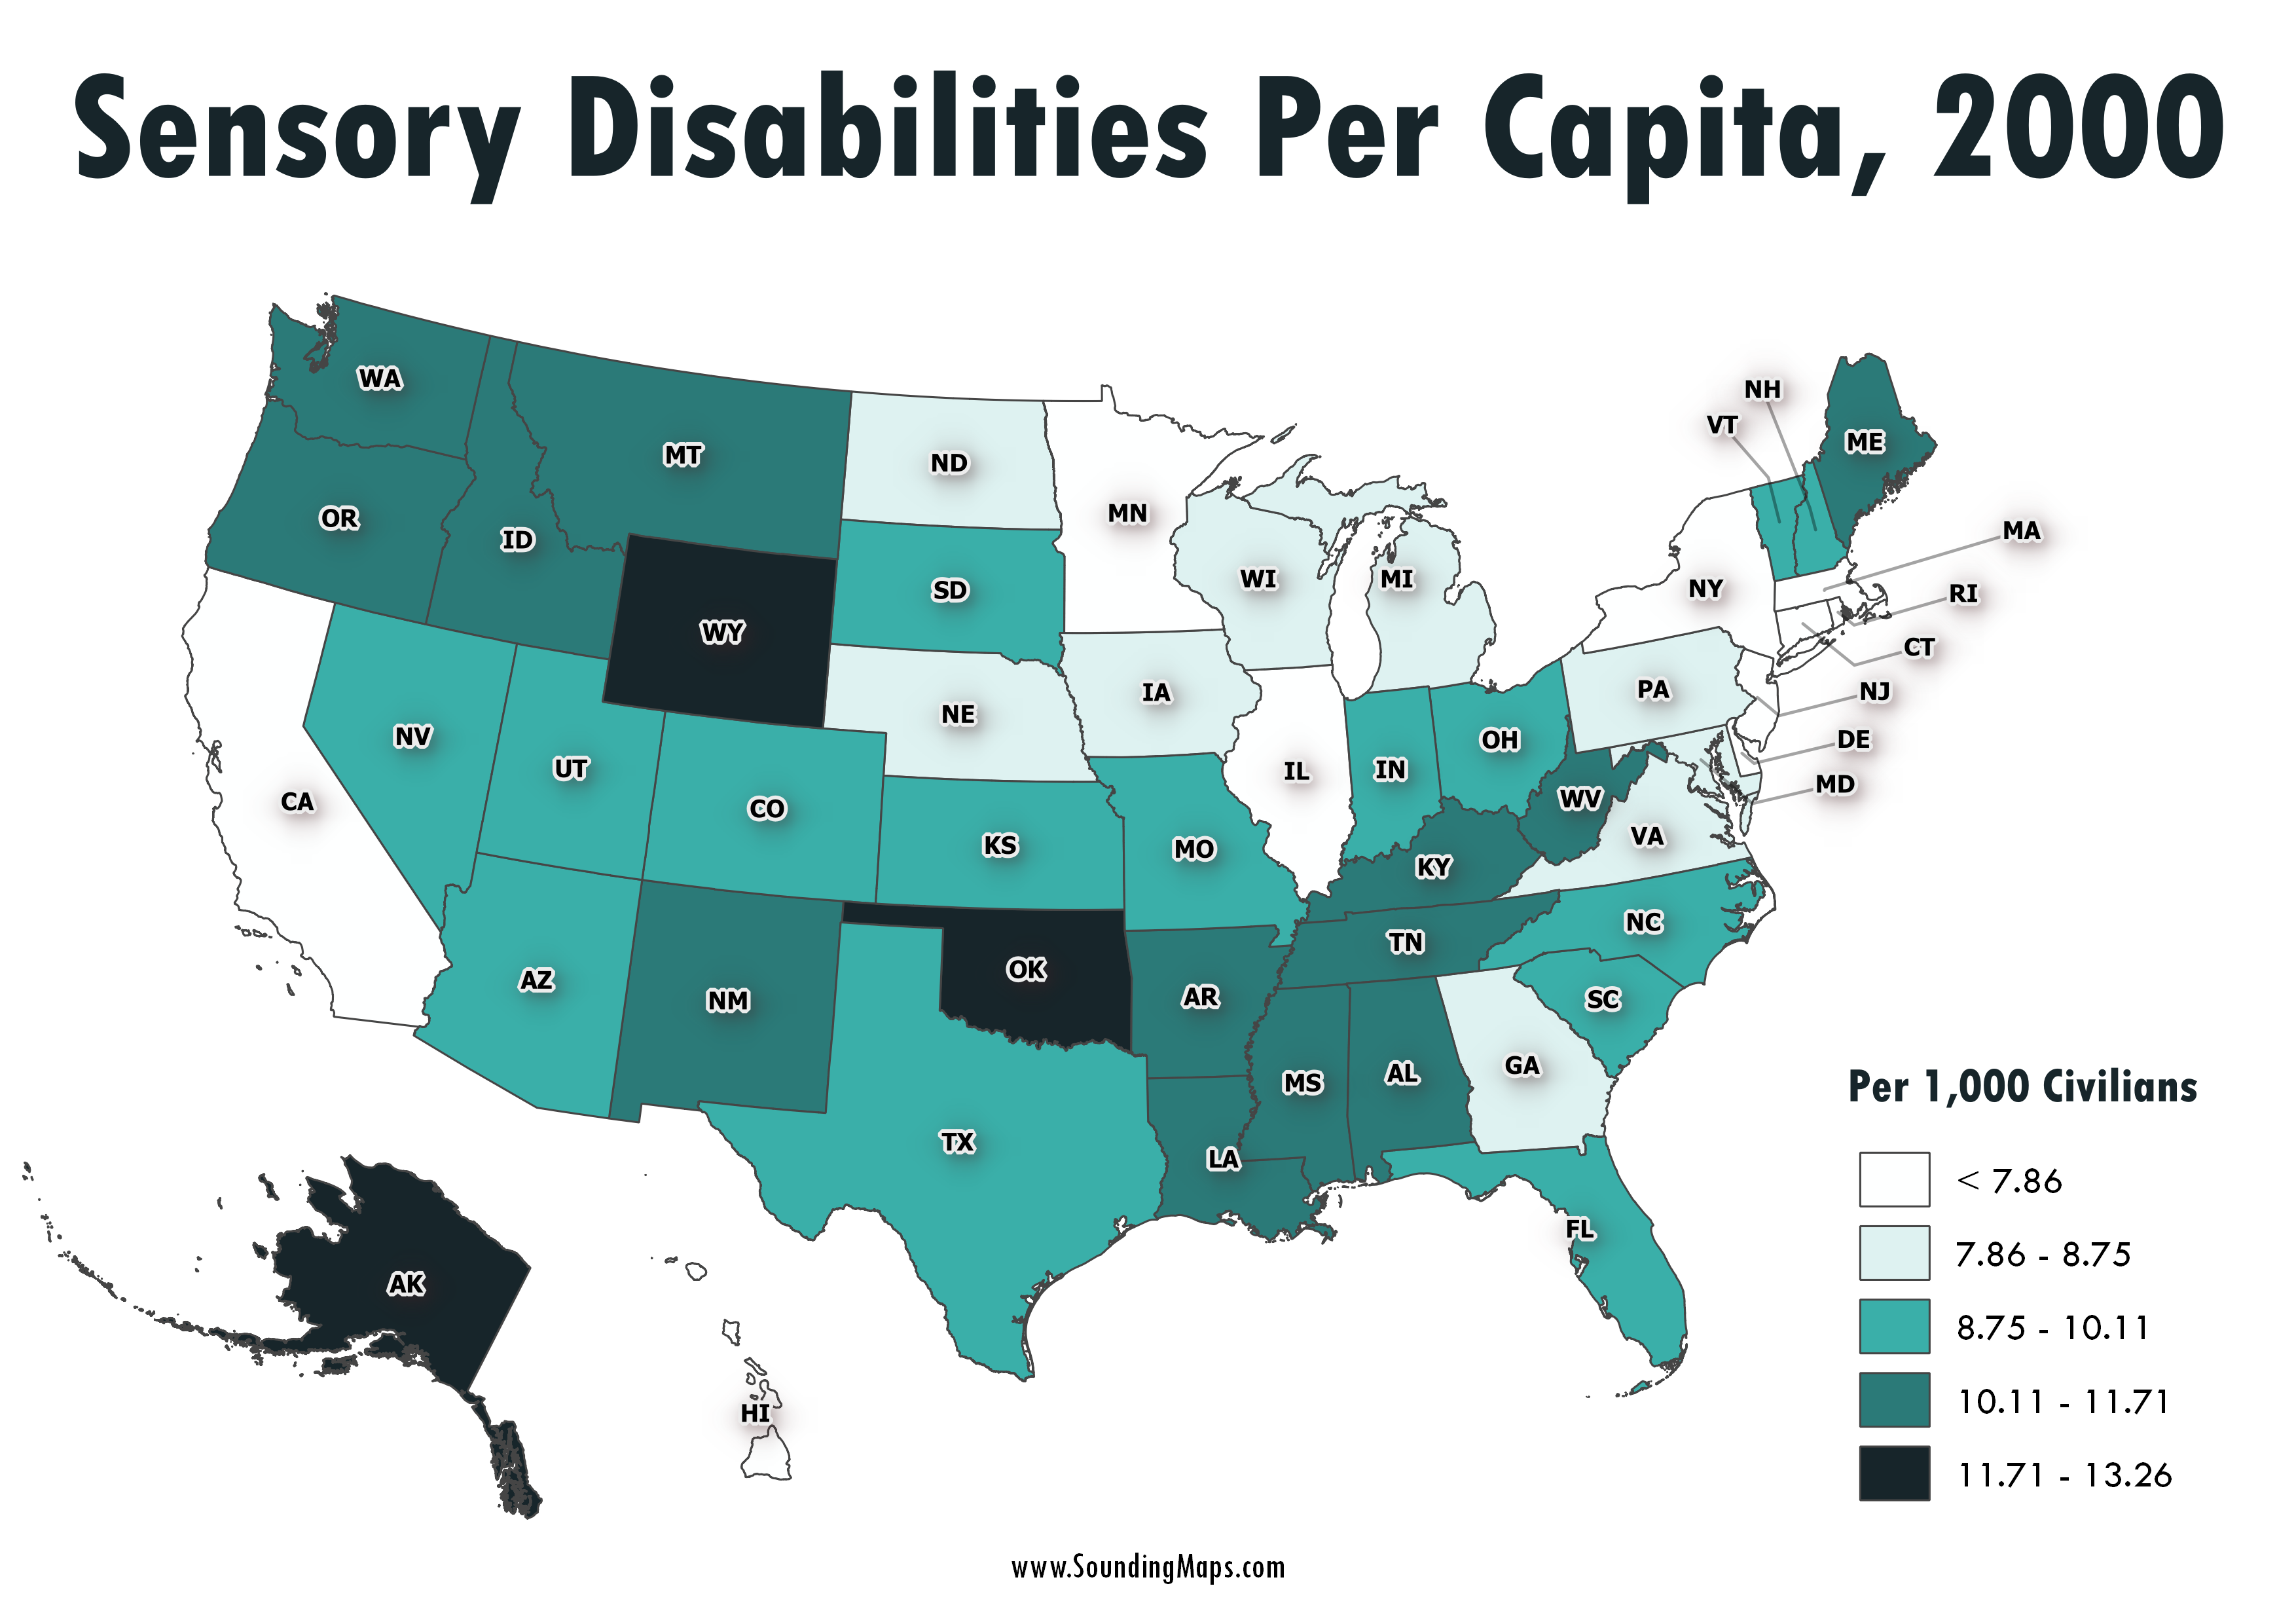
This map shows sensory disabilities throughout the United States in the year 2000. The color coded regions represent disabilities per 1,000 civilians. For instance, Alaska had 12.26 sensory disabilities per 1,000 citizens. Census 2000 counted 49.7 million people with some type of long lasting condition or disability. They represented 19.3 […]
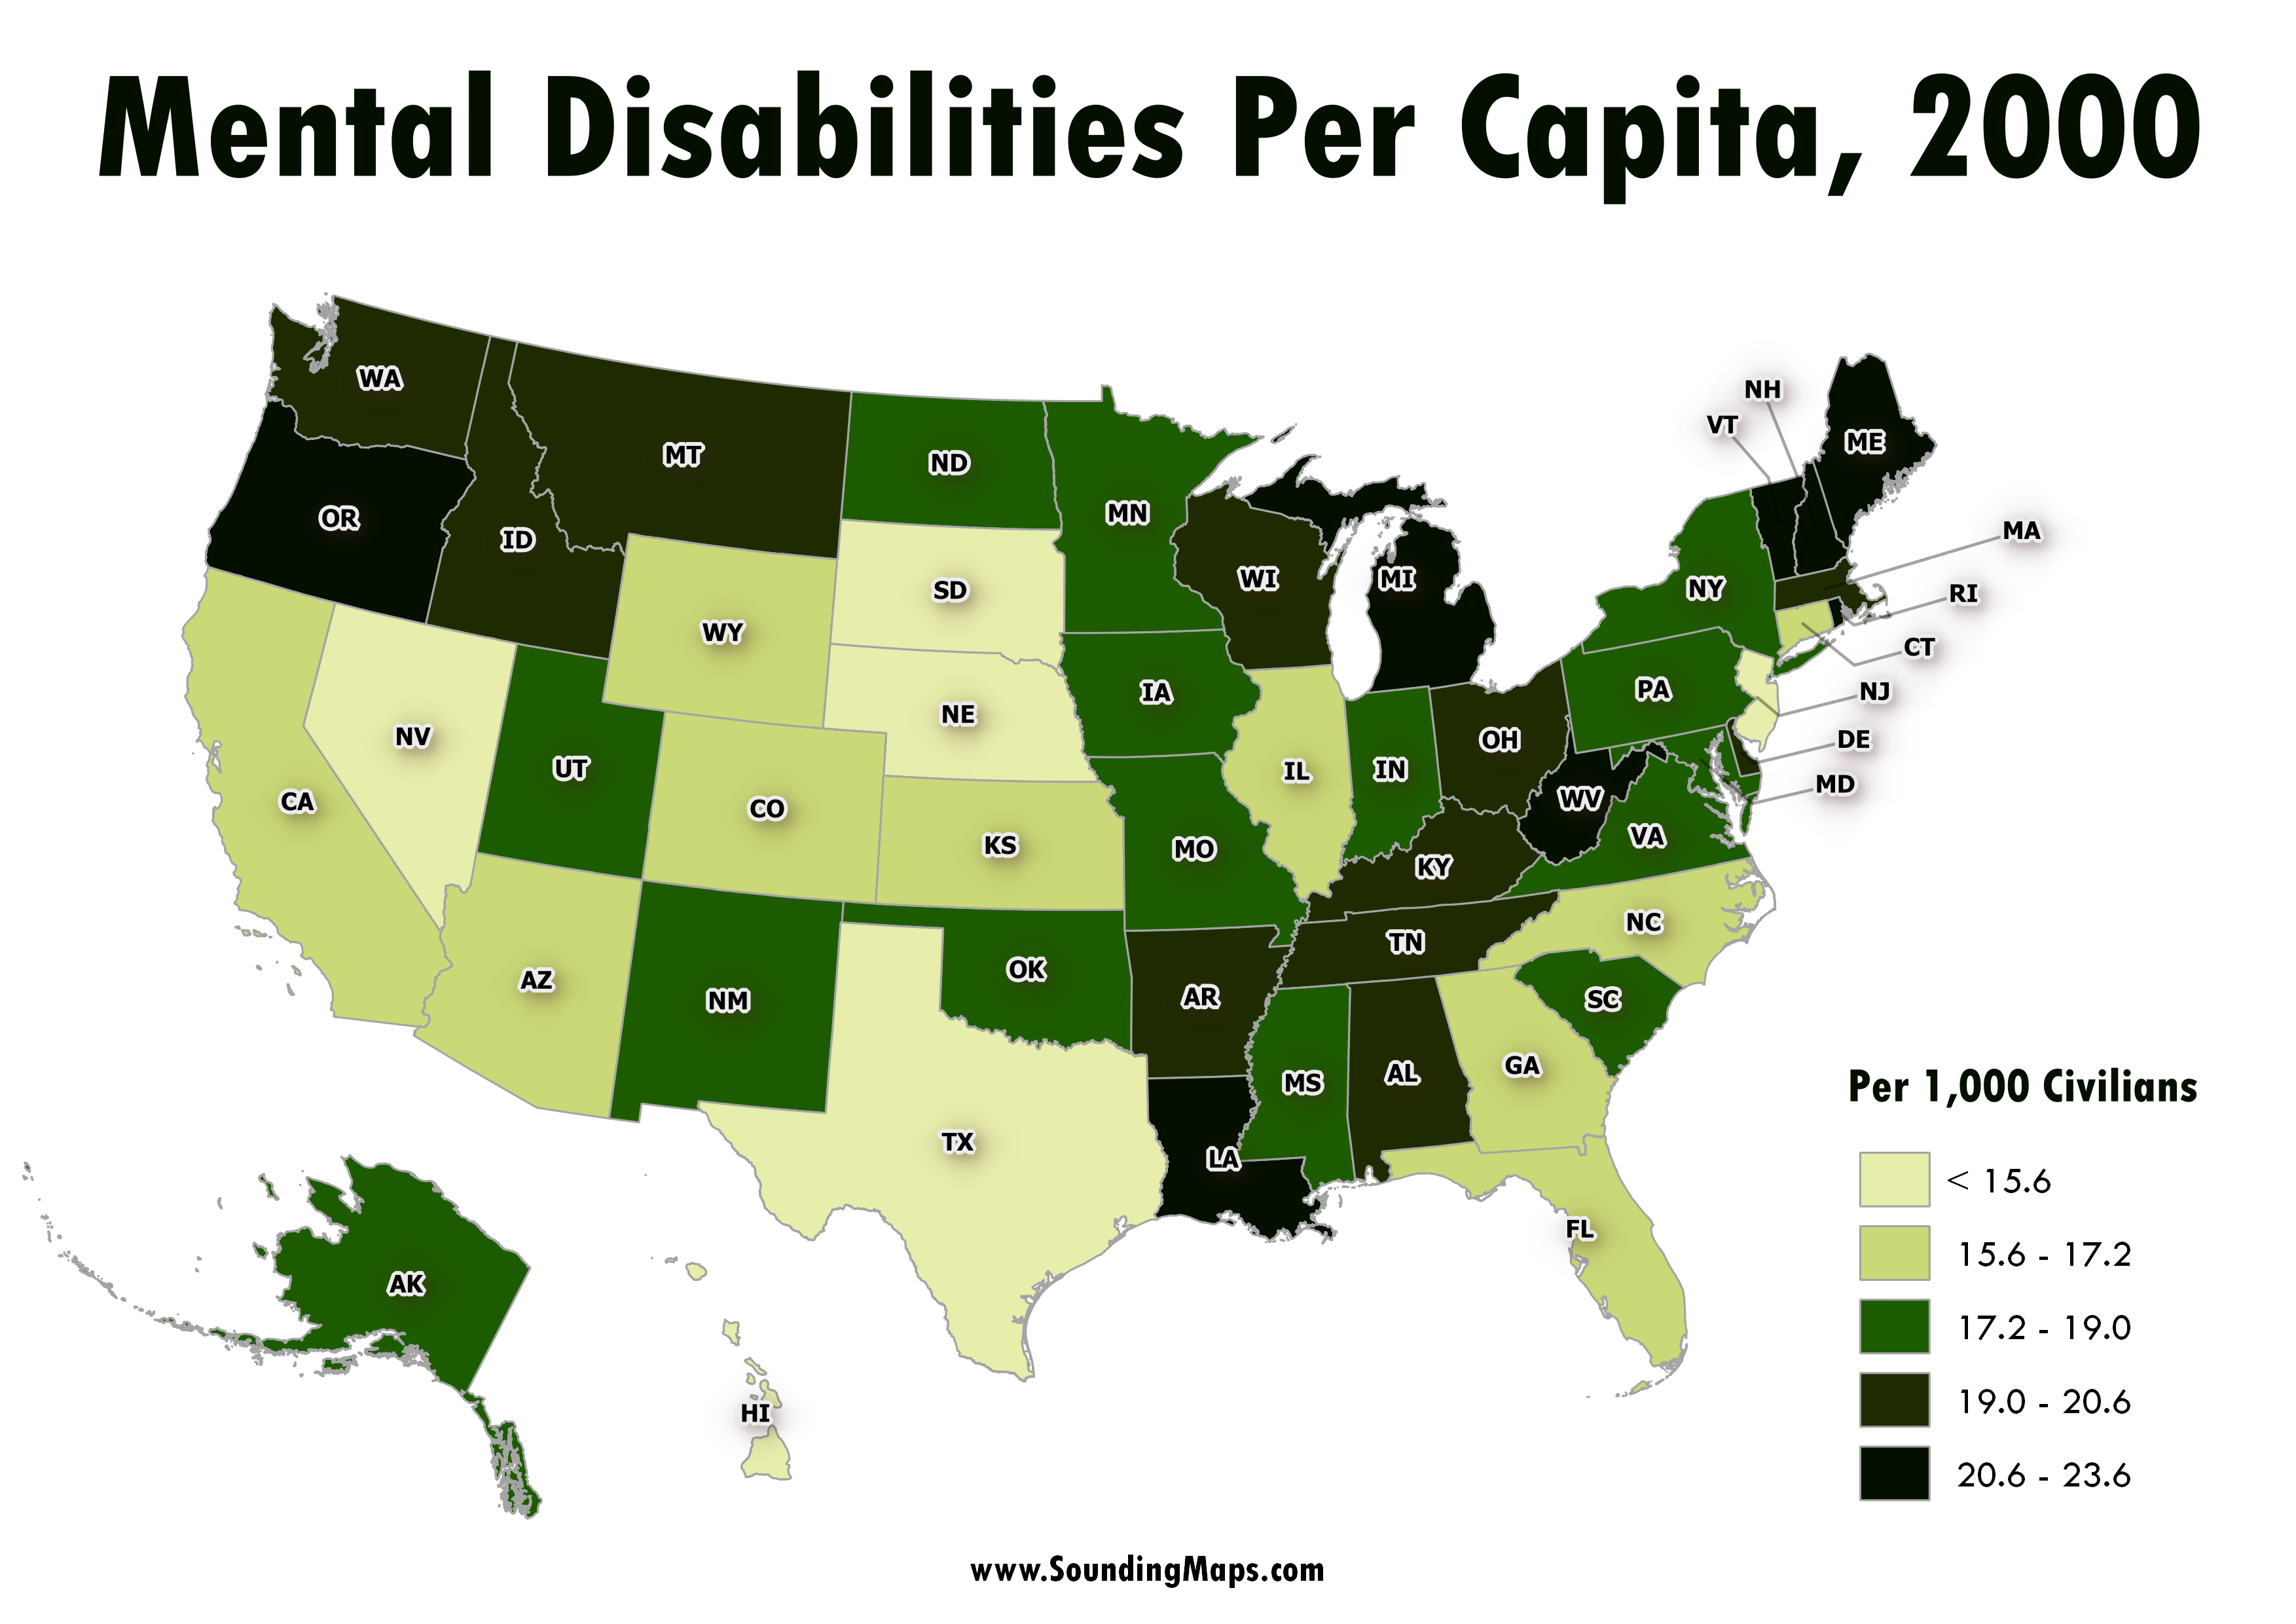
This map represents the mental disability status of the civilian non-institutionalized population of the United States regions in the year 2000. Census 2000 counted 49.7 million people with some type of long lasting condition or disability. They represented 19.3 percent of the 257.2 million people who were aged 5 and […]