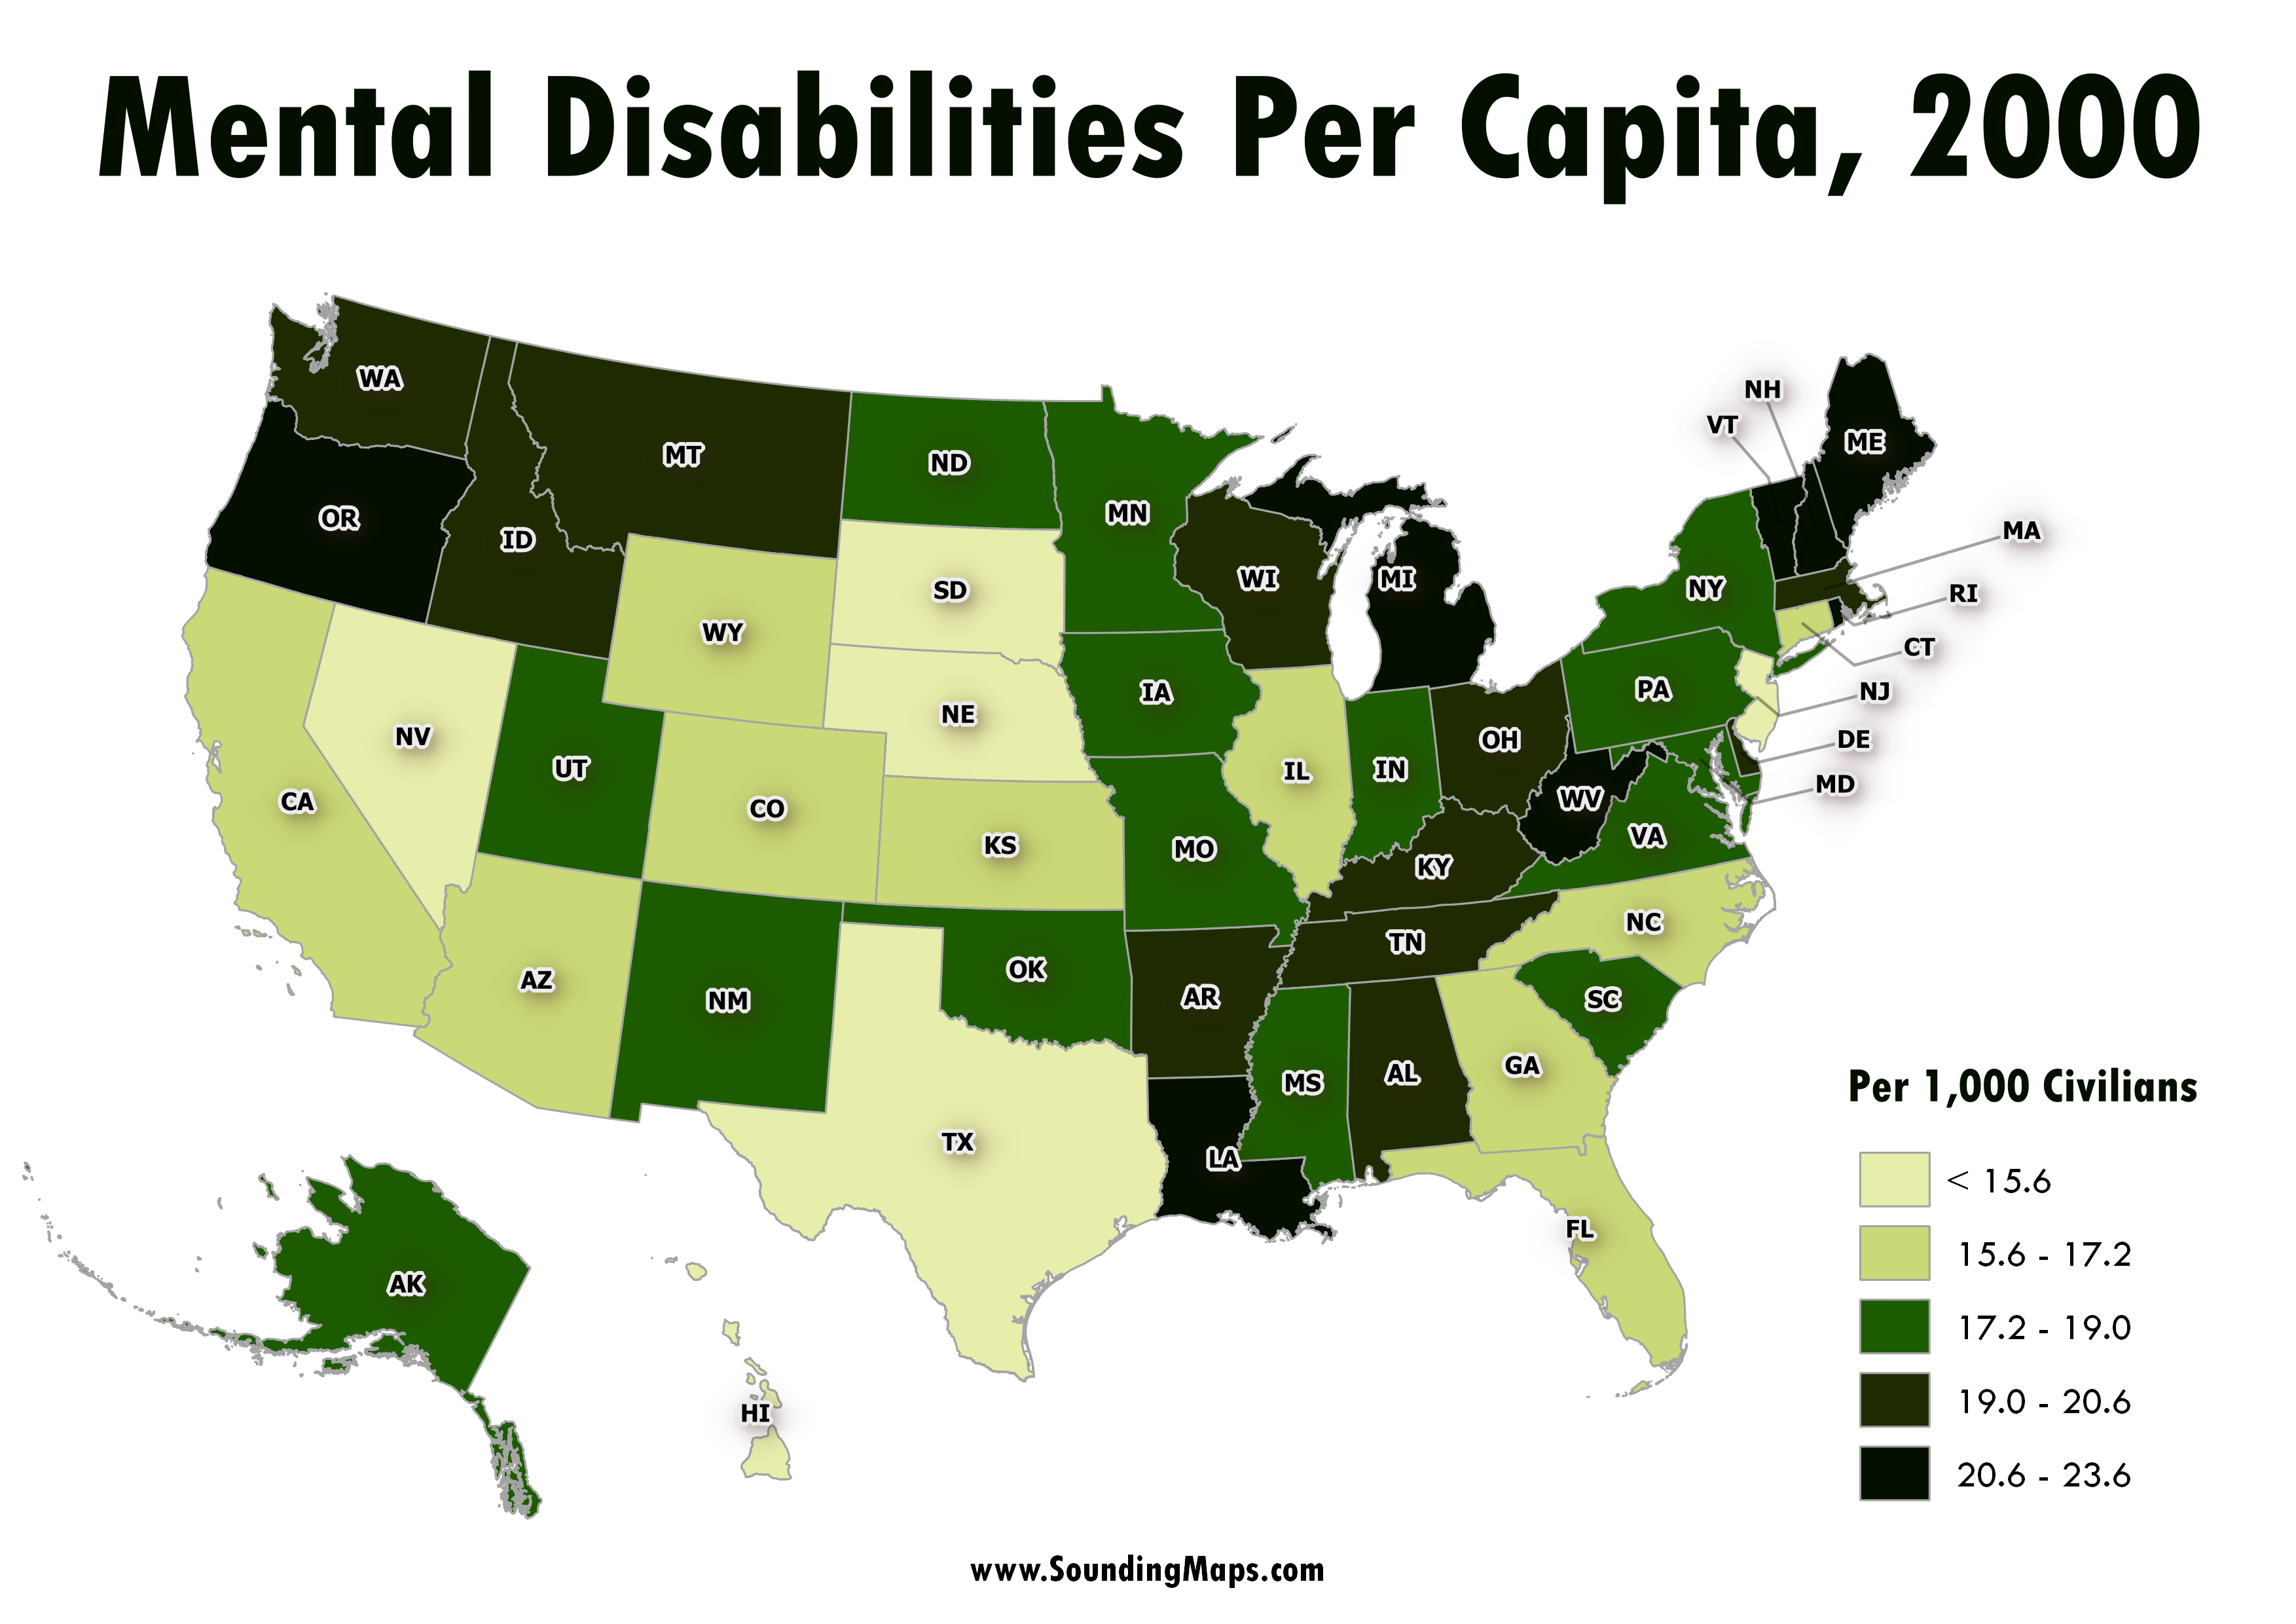
This map represents the mental disability status of the civilian non-institutionalized population of the United States regions in the year 2000.
Census 2000 counted 49.7 million people with some type of long lasting condition or disability. They represented 19.3 percent of the 257.2 million people who were aged 5 and older in the civilian non-institutionalized population — or nearly one person in five. Within this population, Census 2000 found
- 12.4 million (4.8 percent) with a physical, mental, or emotional condition causing difficulty in learning, remembering, or concentrating.
- 6.8 million (2.6 percent) with a physical, mental, or emotional condition causing difficulty in dressing, bathing
- 18.2 million (8.6 percent) of those aged 16 and older with a condition that made it difficult to go outside the home to shop or visit a doctor
Maine has the highest amount of people with mental disabilities per capita.
- Maine – 23.61
- Vermont – 22.42
- Rhode Island – 22.26
- West Virginia – 22.19
- Oregon – 21.65
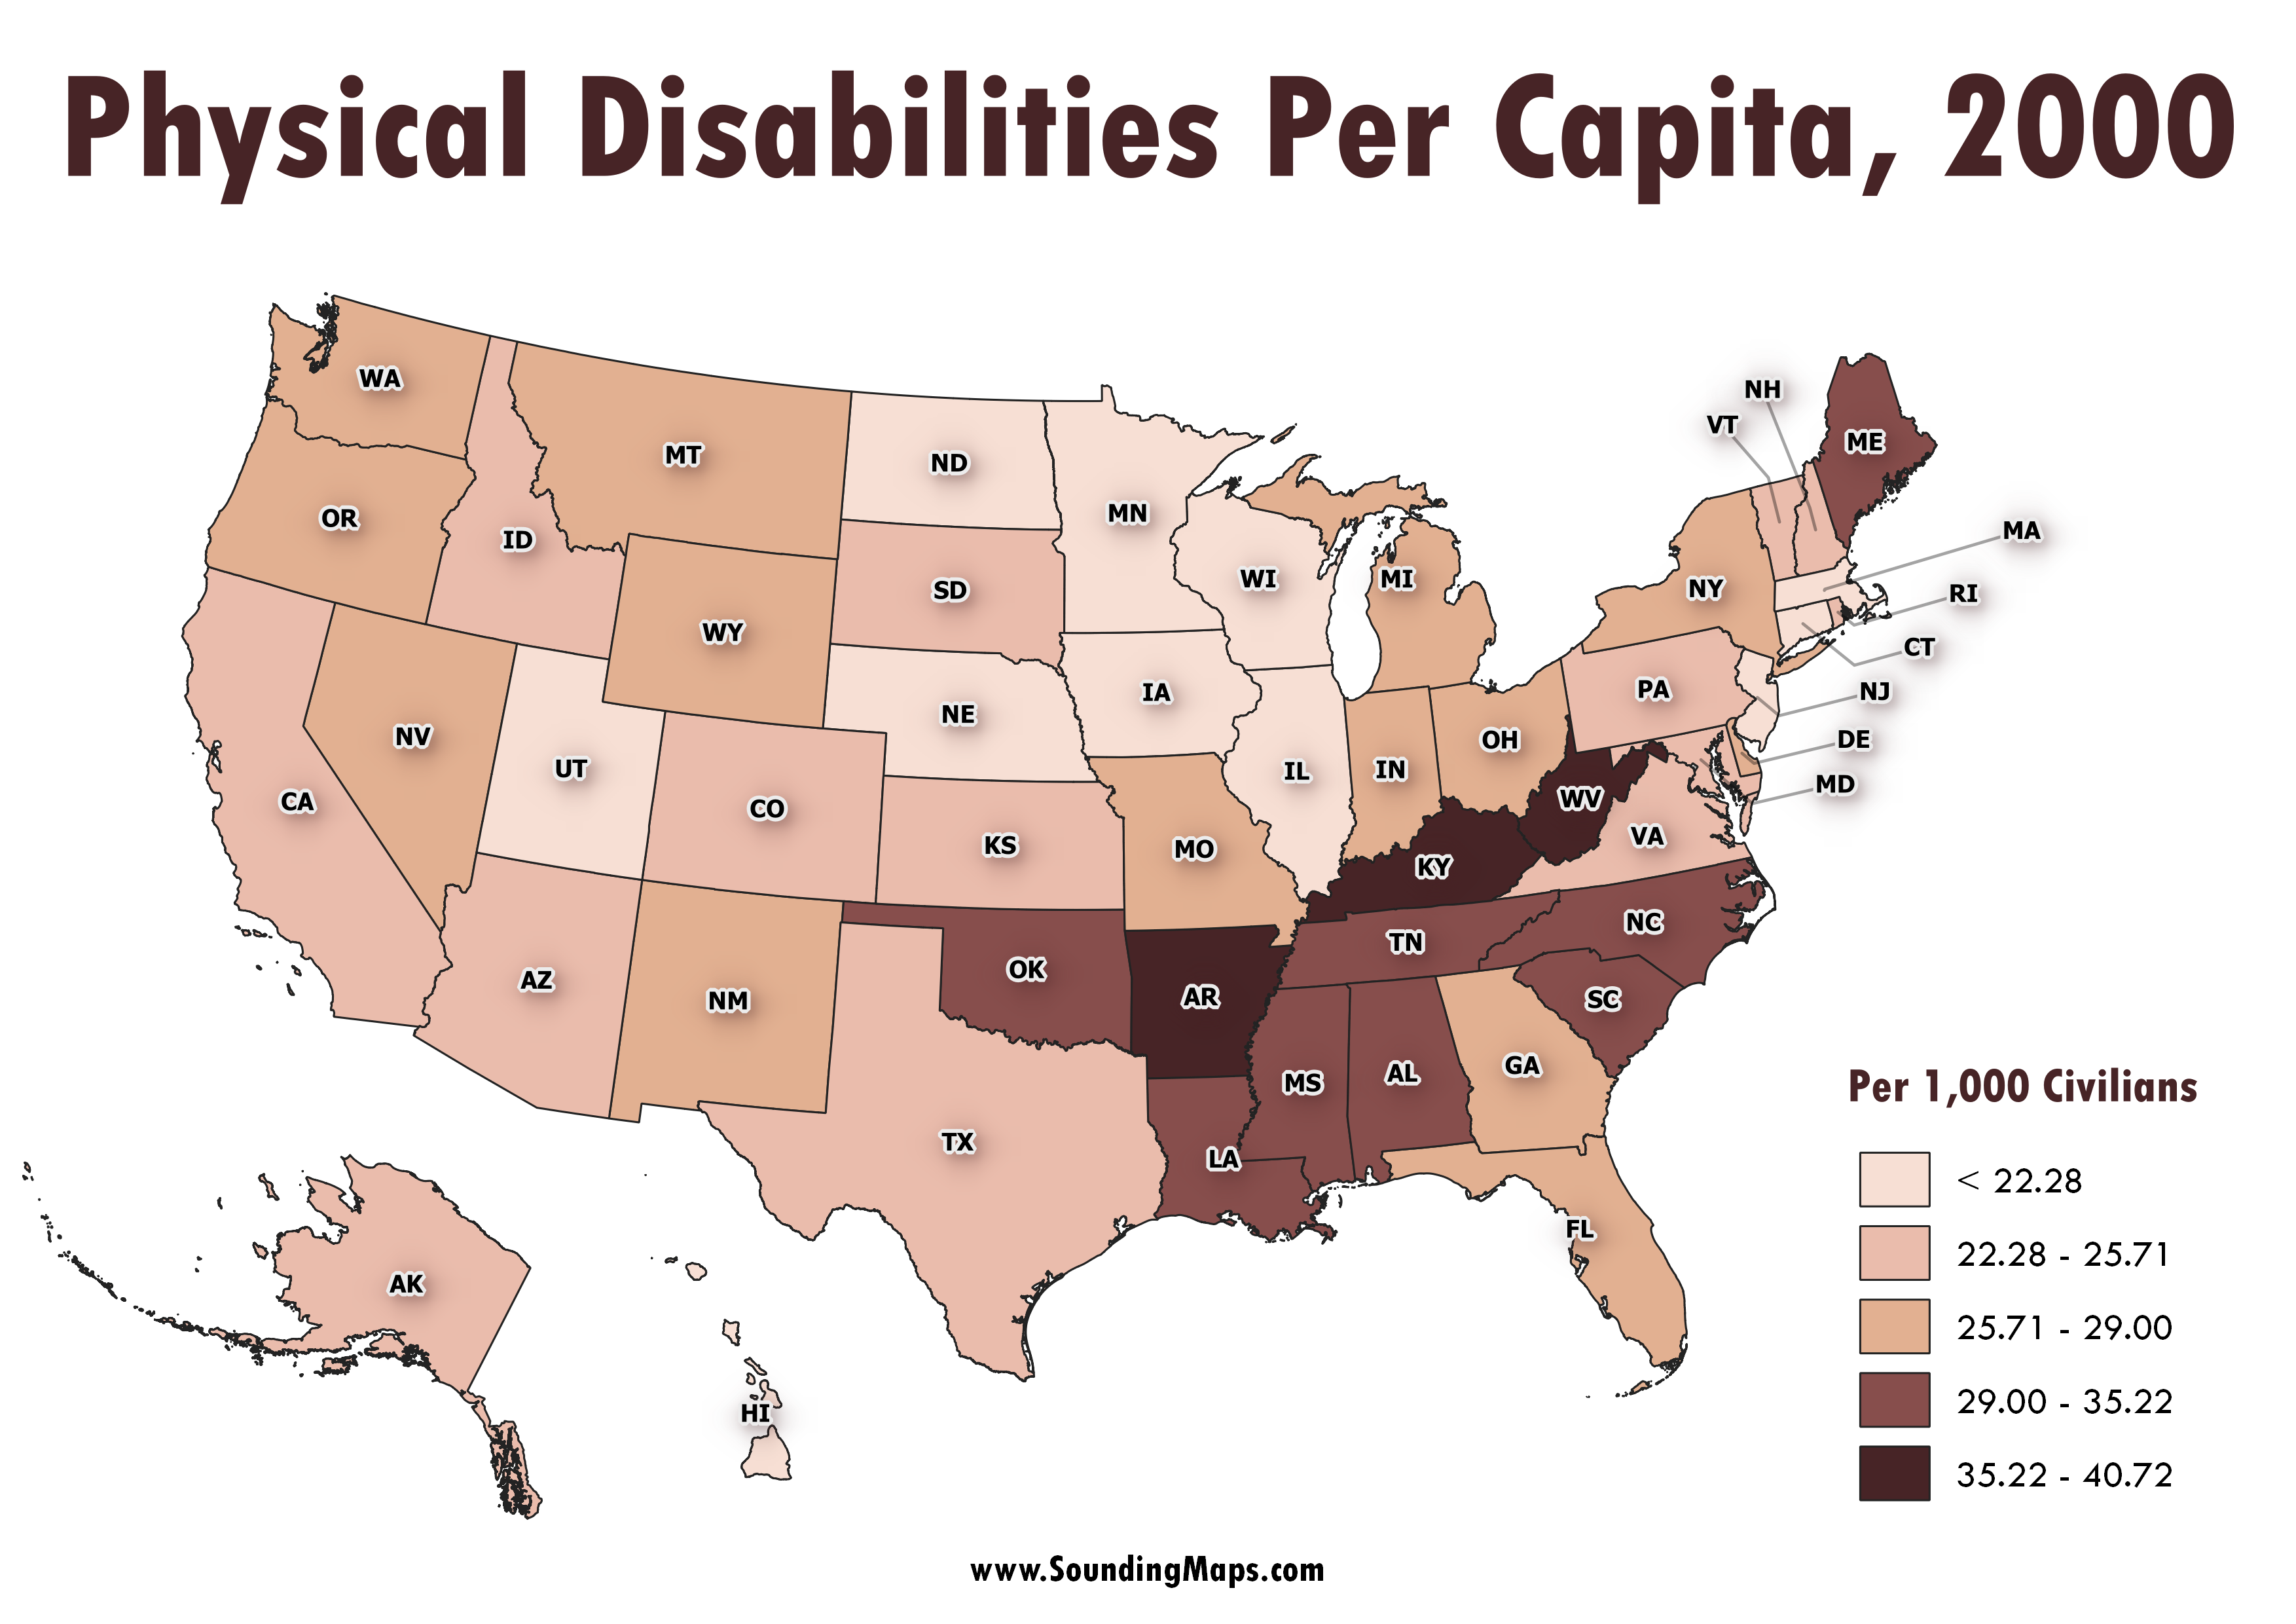
You can also see similar maps of Physical Disabilities and Sensory Disabilities