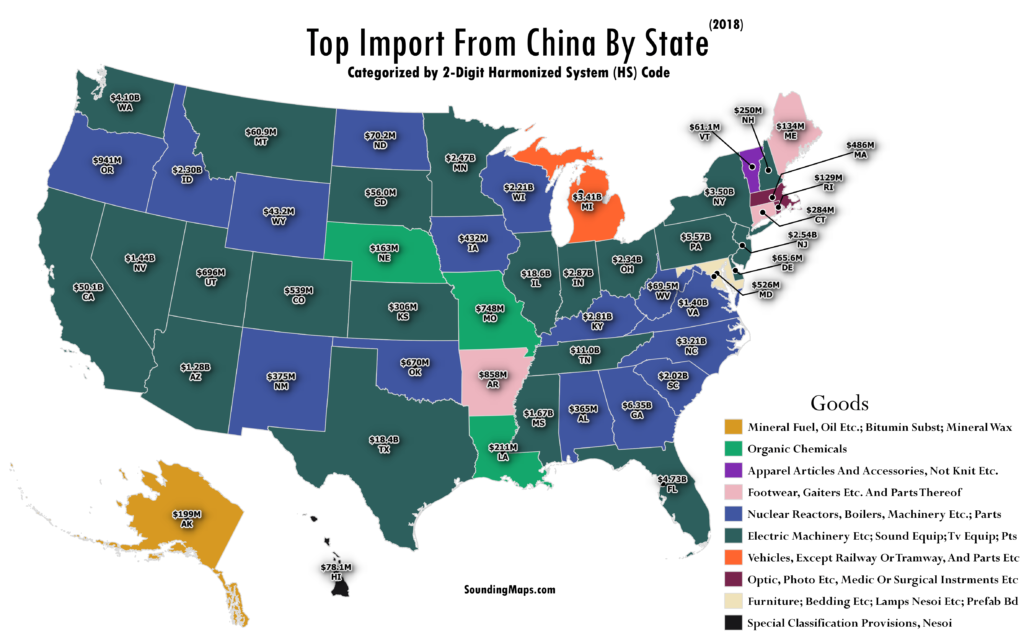
This map highlights the top imports to the United States from China for each state categorized by 2-Digit Harmonized System (HS) codes. The HS coding system is an internationally standardized system of names and numbers to classify trade products. Although using a 6 digit code will provide more insight into each good, the 2-digit code was used instead for brevity purposes. The 6-digit code legend will yield around 30 keys whereas the 2-digit cap at 10 keys.
China remains as the United States largest trading partner with $659.8 billion in total (two way) goods trade during 2018. The top import categories (2-digit HS) in 2018 were: electrical machinery ($152 billion), machinery ($117 billion), furniture and bedding ($35 billion), toys and sports equipment ($27 billion), and plastics ($19 billion).
I’ve also created a map on Top Exports To China By State in the past. See it here.
This map was created using QGIS. A free and open source GIS tool.
source: https://usatrade.census.gov/data