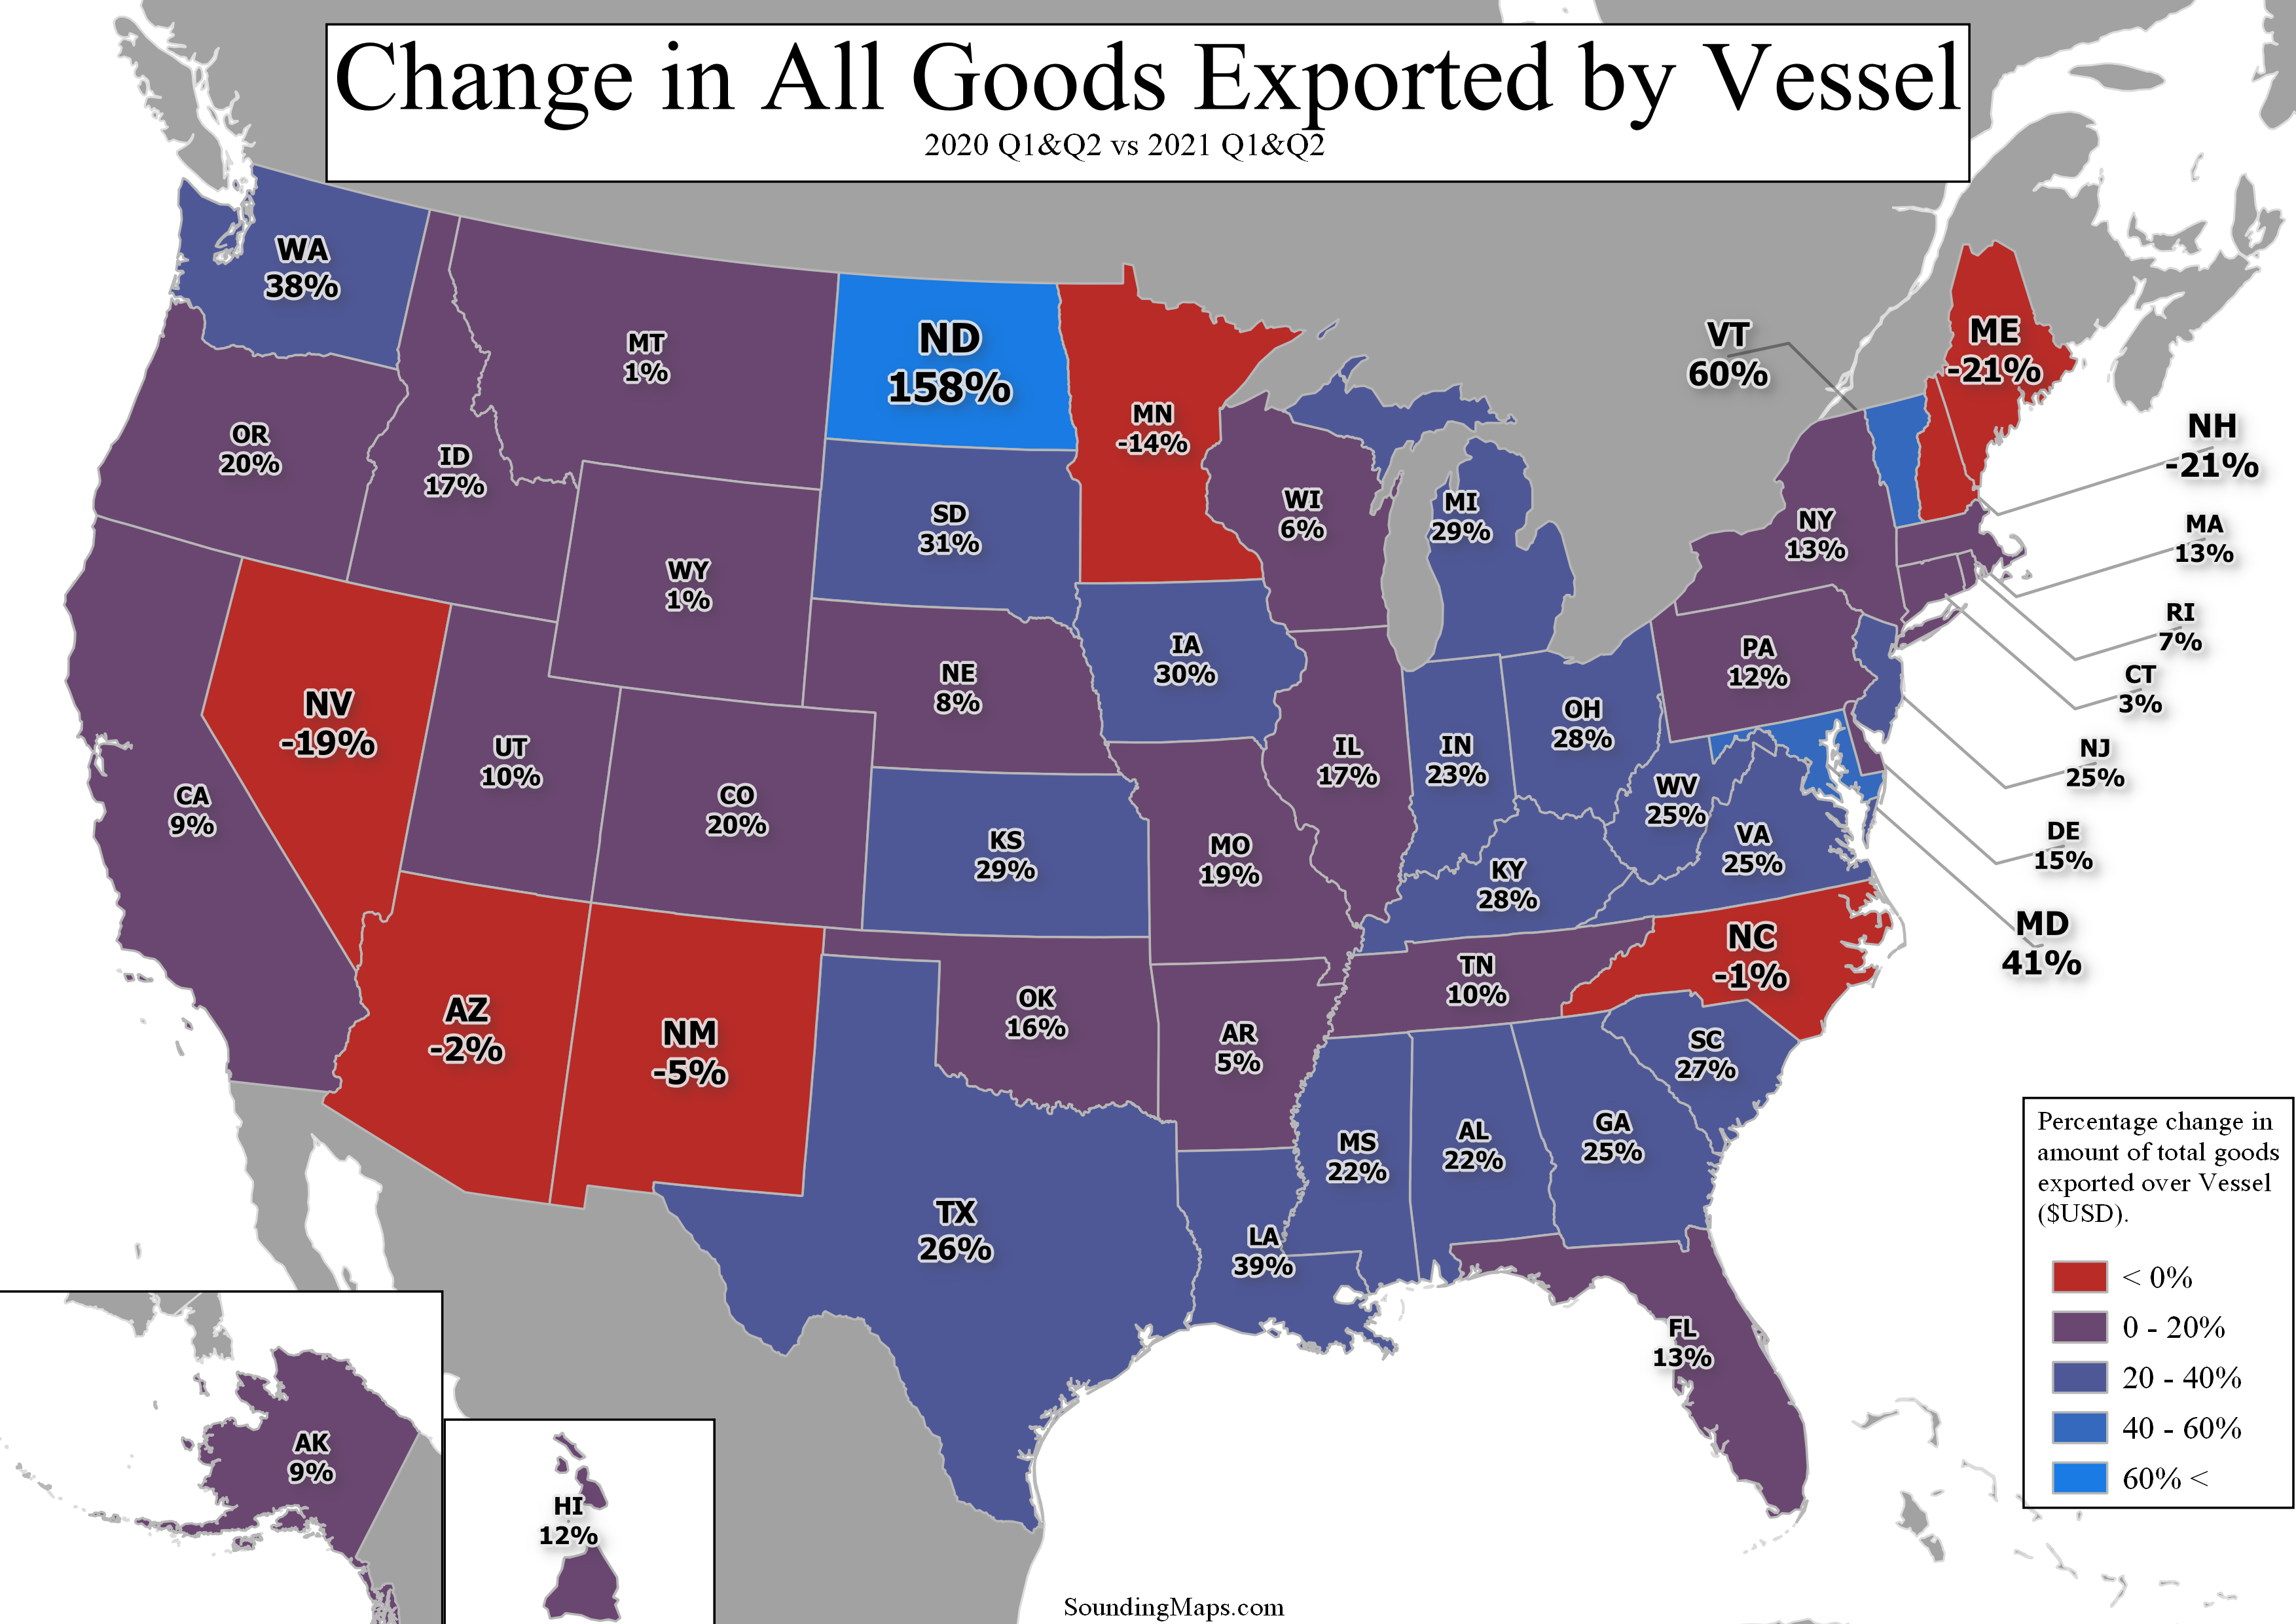
Now, this map shows key states that are adopting new modes of exporting goods. The mode being vessel.
Vessel Exports
Data was gathered from USA Trade Census and goods were classified using the HS code system.
The vessel exports change was calculated taking the value of trade through vessel ports (seaborne trade) from January to June of 2020 compared to January to June of 2021. This provides an insight as to which states chose to adopt additional vessel shipping compared to those who adopted other methods.
North Dakota Ramps Up
One state’s vessel exports change stood out specifically:
North Dakota.
Oil and Agriculture is the name of the game for the state.
A few others also stood out a tremendous amount. With railroads congested and inspection times slowing down, North Dakota has moved many of it’s Soybean and Oil shipping export chains over to vessel instead of train.
- North Dakota 158%
- Vermont 60%
- Maryland 38%
The states that had the largest decrease in vessel exports change were:
- Maine -21%
- New Hampshire -21%
- Nevada -19%
Sources:
This map was created using QGIS. A free and open source GIS tool.