
Physical disabilities USA!
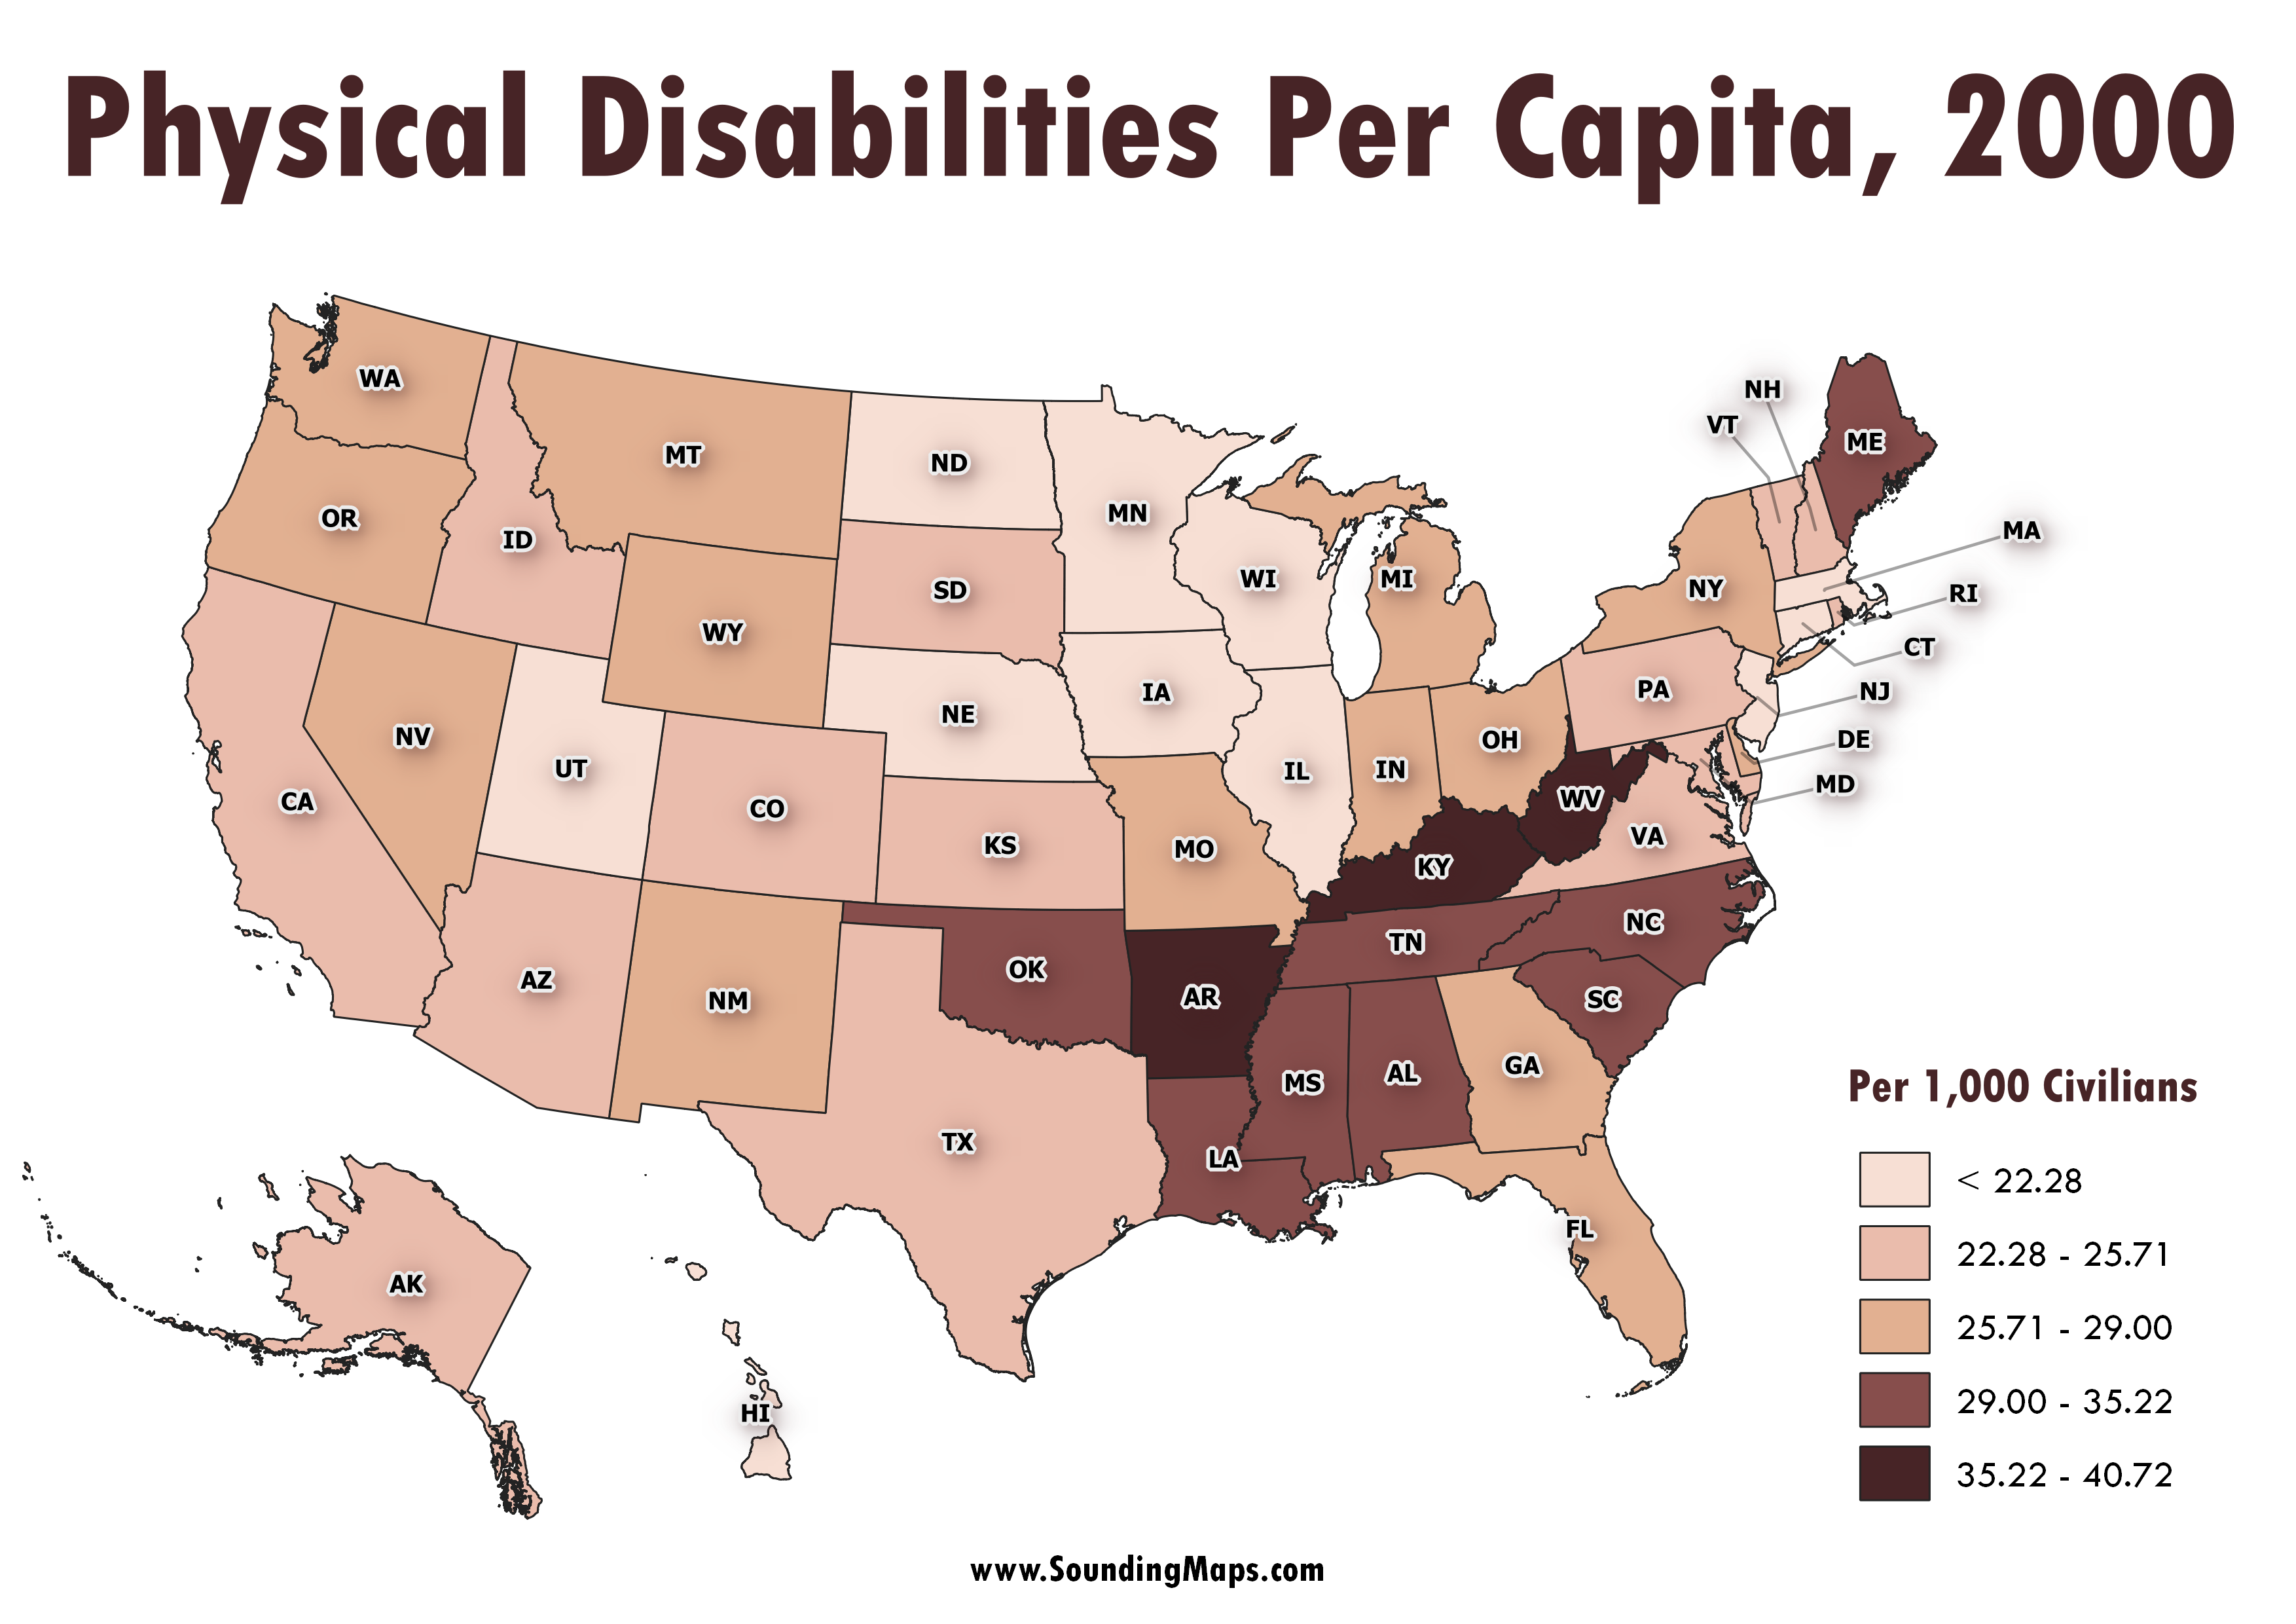
This map reveals the cluster of states with high rates of physical disabilities measured per capita. Turns out, the concentration take holds in the South Eastern United States.
Census 2000, marking the turn of the millennia, surveyed disability status’ of Americans. The total count of a person with some type of long lasting condition or disability are surveyed on the following:
- Blindness
- Deafness
- Vision impairment
- Hearing impairment
- Walking limitations
- Climbing stairs limitations
- Reaching limitations
- Carrying limitations
- Lifting limitations
And that’s just part of the story…
Among the States, the physical disability rate was highest in West Virginia
Among the states, the highest was in West Virginia. But wait, let me tell you something. The state is home to the highest median age in the United States. This goes hand in hand, obviously, with any type of disabilty.
It’s followed closely by four other Southern states:
Kentucky, Arkansas, Mississippi and Alabama.
It’s surprising to no one, considering the amount of blue collar work in the region.
In 2000, counties with very high rates were clustered in the coal mining areas
Nearly all of the states that are on the higher end of the physical disability spectrum are located in the coal-mining region.
As a result, the health repercussions of coal miners and other vocations in the region appear noticeably on this map.
Almost two out of every five with a disability live in the South
Even though only 35.5 percent of the population 5 and older live in the South, this region is home to 38.3 percent of the people with disabilities.
Coupled with the fact that the South contains the largest total population among the four regions.
Top 5 USA disability rankings
In case you ask for it…
The top 5 states ranking are as follows:
- West Virginia – 40.72
- Kentucky – 40.27
- Arkansas – 36.92
- Mississippi – 35.22
- Alabama – 34.34
For further reading and viewing, I’ve created similar maps of Sensory Disabilities and Mental Disabilities.

One thought on “Which States have the Highest Disabled Population?”
It is critical for our government to review and cull the ones who are NOT DISABLED. I am familiar with one who received full disability for legally blind and he drives every day. What a fraud!