Mapped: The Largest Export Good to China of Every State
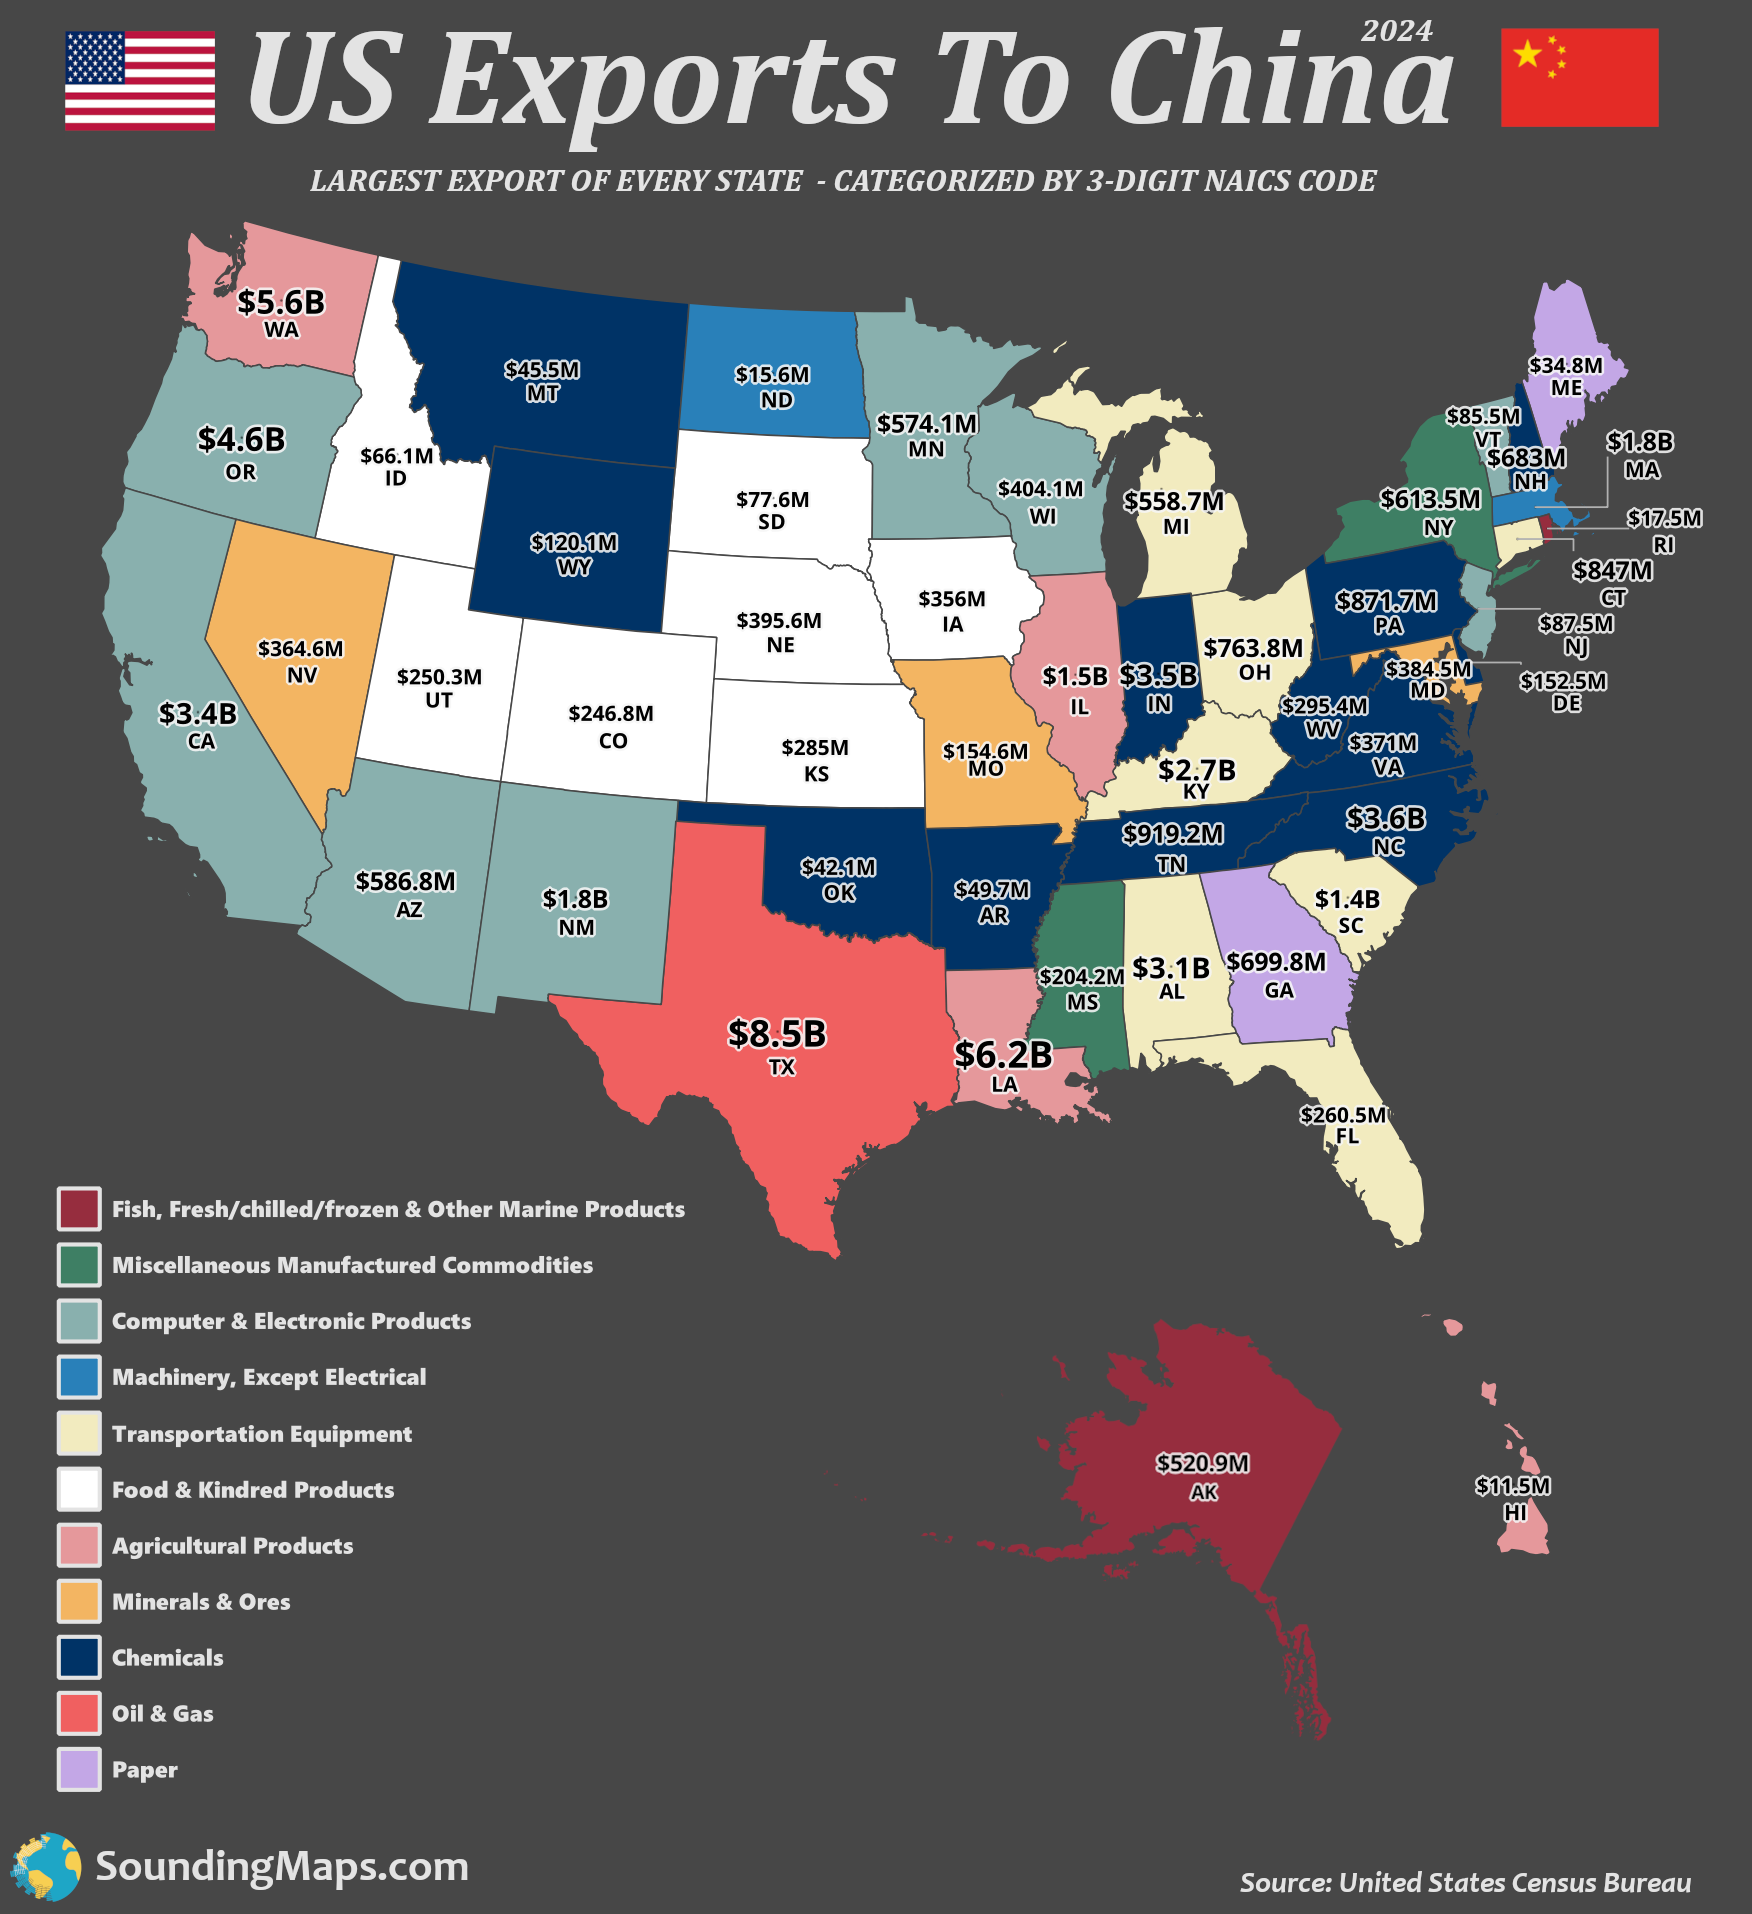
This map visualizes the most significant export goods to China by each state. The Midwest overwhelmingly exports food and kindred products, including meat, dairy, vegetables, and grains. A good portion of the food products in the Midwest states were meat.
The western states from Oregon to California and Arizona to New Mexico export large amounts of computer and electronic products to China, much of which are navigational/medical/control instruments and semiconductors.
Chemicals comprise a large portion of exports from Oklahoma, Arkansas, Tennessee, Wyoming, Montana, North Carolina, Virginia, West Virginia, Indiana, Pennsylvania, and New Hampshire.
| State | NAICS 2-Digit Code | USD |
|---|---|---|
| Alabama | 336 Transportation Equipment | $3,074,896,055 |
| Alaska | 114 Fish, Fresh/chilled/frozen & Other Marine Products | $520,899,284 |
| Arizona | 334 Computer & Electronic Products | $586,754,949 |
| Arkansas | 325 Chemicals | $49,701,889 |
| California | 334 Computer & Electronic Products | $3,403,133,032 |
| Colorado | 311 Food & Kindred Products | $246,797,024 |
| Connecticut | 336 Transportation Equipment | $847,038,463 |
| Delaware | 325 Chemicals | $152,537,039 |
| Dist of Columbia | 332 Fabricated Metal Products, Nesoi | $1,760,362 |
| Florida | 336 Transportation Equipment | $260,488,928 |
| Georgia | 322 Paper | $699,786,114 |
| Hawaii | 111 Agricultural Products | $11,515,863 |
| Idaho | 311 Food & Kindred Products | $66,146,975 |
| Illinois | 111 Agricultural Products | $1,477,429,196 |
| Indiana | 325 Chemicals | $3,452,118,074 |
| Iowa | 311 Food & Kindred Products | $355,963,599 |
| Kansas | 311 Food & Kindred Products | $285,026,588 |
| Kentucky | 336 Transportation Equipment | $2,674,482,768 |
| Louisiana | 111 Agricultural Products | $6,203,580,636 |
| Maine | 322 Paper | $34,832,180 |
| Maryland | 212 Minerals & Ores | $384,498,520 |
| Massachusetts | 333 Machinery, Except Electrical | $1,834,156,267 |
| Michigan | 336 Transportation Equipment | $558,725,175 |
| Minnesota | 334 Computer & Electronic Products | $574,125,708 |
| Mississippi | 339 Miscellaneous Manufactured Commodities | $204,168,575 |
| Missouri | 212 Minerals & Ores | $154,562,149 |
| Montana | 325 Chemicals | $45,476,423 |
| Nebraska | 311 Food & Kindred Products | $395,612,420 |
| Nevada | 212 Minerals & Ores | $364,622,242 |
| New Jersey | 334 Computer & Electronic Products | $87,451,263 |
| New Hampshire | 325 Chemicals | $682,993,736 |
| New Mexico | 334 Computer & Electronic Products | $1,779,287,128 |
| New York | 339 Miscellaneous Manufactured Commodities | $613,530,231 |
| North Carolina | 325 Chemicals | $3,640,657,730 |
| North Dakota | 333 Machinery, Except Electrical | $15,564,143 |
| Ohio | 336 Transportation Equipment | $763,842,749 |
| Oklahoma | 325 Chemicals | $42,148,308 |
| Oregon | 334 Computer & Electronic Products | $4,583,915,277 |
| Pennsylvania | 325 Chemicals | $871,745,609 |
| Rhode Island | 114 Fish, Fresh/chilled/frozen & Other Marine Products | $17,470,994 |
| South Carolina | 336 Transportation Equipment | $1,368,325,050 |
| South Dakota | 311 Food & Kindred Products | $77,621,816 |
| Tennessee | 325 Chemicals | $919,231,398 |
| Texas | 211 Oil & Gas | $8,502,936,006 |
| Utah | 311 Food & Kindred Products | $250,286,520 |
| Vermont | 334 Computer & Electronic Products | $85,494,768 |
| Virginia | 325 Chemicals | $371,026,349 |
| Washington | 111 Agricultural Products | $5,602,827,799 |
| West Virginia | 325 Chemicals | $295,358,742 |
| Wisconsin | 334 Computer & Electronic Products | $404,098,643 |
| Wyoming | 325 Chemicals | $120,115,871 |
Methodology of Making the US-China Export Map
We leveraged the NAICS (North American Industry Classification System) data, which is used mainly in the U.S., Canada, and Mexico, for statistical and regulatory purposes by the United States. The map shows exports to China throughout 2024.
HS (Harmonized System) data for exports is also more helpful when analyzing international trade, customs, or tariffs. NAICS is more useful when analyzing industries, businesses, or employment trends. We considered using the HS system at first, but the data overlaid on the map became overwhelming due to the complex nature of classifying goods in the HS system. Over 10 codes exist within the HS system, whereas the NAICS system maxes out between 6 and 8.
We found that the 3-digit NAICS code created a cleaner visualization without muddying the depiction of the data.