
The Top Countries Who Buys the Most Goods from Each State
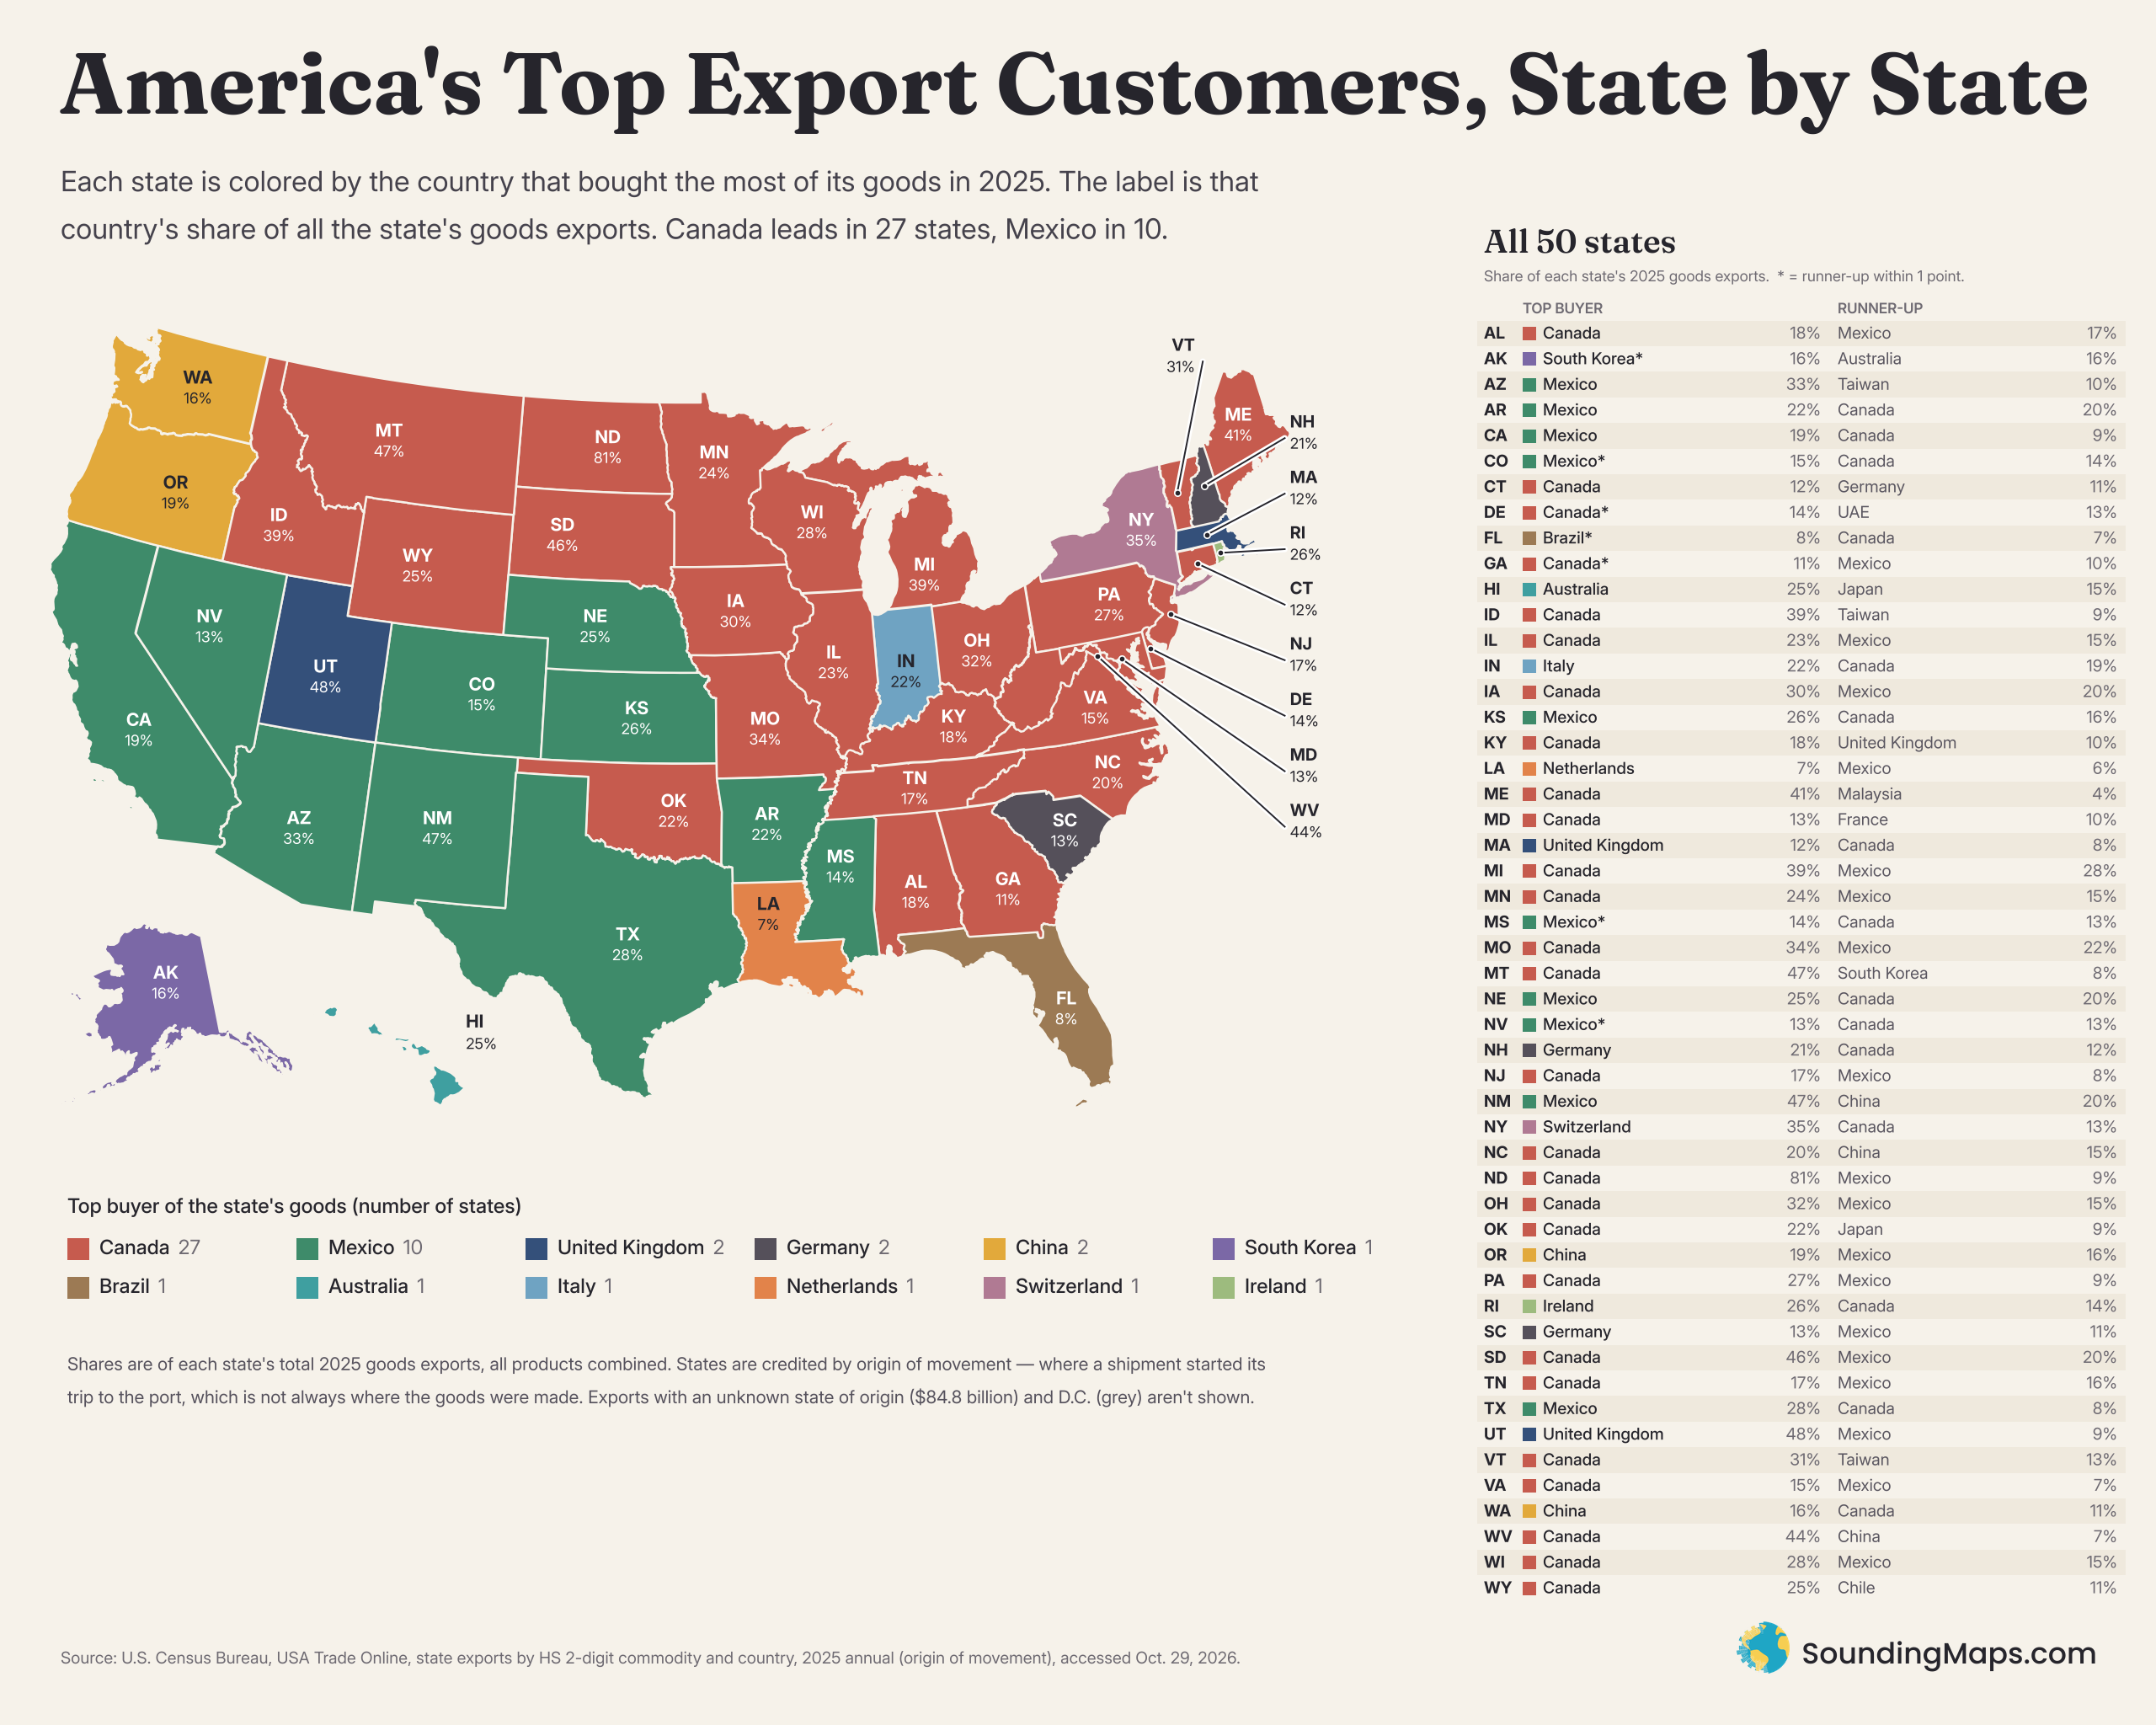
Canada bought more goods than any other country from 27 states in 2025, and Mexico led for 10 more.
Canada’s red covers the northern tier, the Midwest and much of the South. In North Dakota it isn’t close: Canada bought 81% of the state’s goods exports. Utah (48%), New Mexico and Montana (both 47%), South Dakota (46%) and West Virginia (44%) also send close to half their exports to a single country. Mexico’s green runs from California to Nebraska, and it’s the top buyer for Texas, by far the largest exporting state.
Aside from Canada and Mexico, a few other countries are the largest export markets for several states:
- New York’s top buyer is Switzerland, and Utah’s is the United Kingdom. Both are driven by gold.
- Indiana’s is Italy.
- South Carolina’s is Germany.
- Rhode Island’s is Ireland.
- Washington’s and Oregon’s is China.
Some states spread their trade widely. Louisiana’s top buyer, the Netherlands, takes only 7%.
What Each State Sells The Most Of
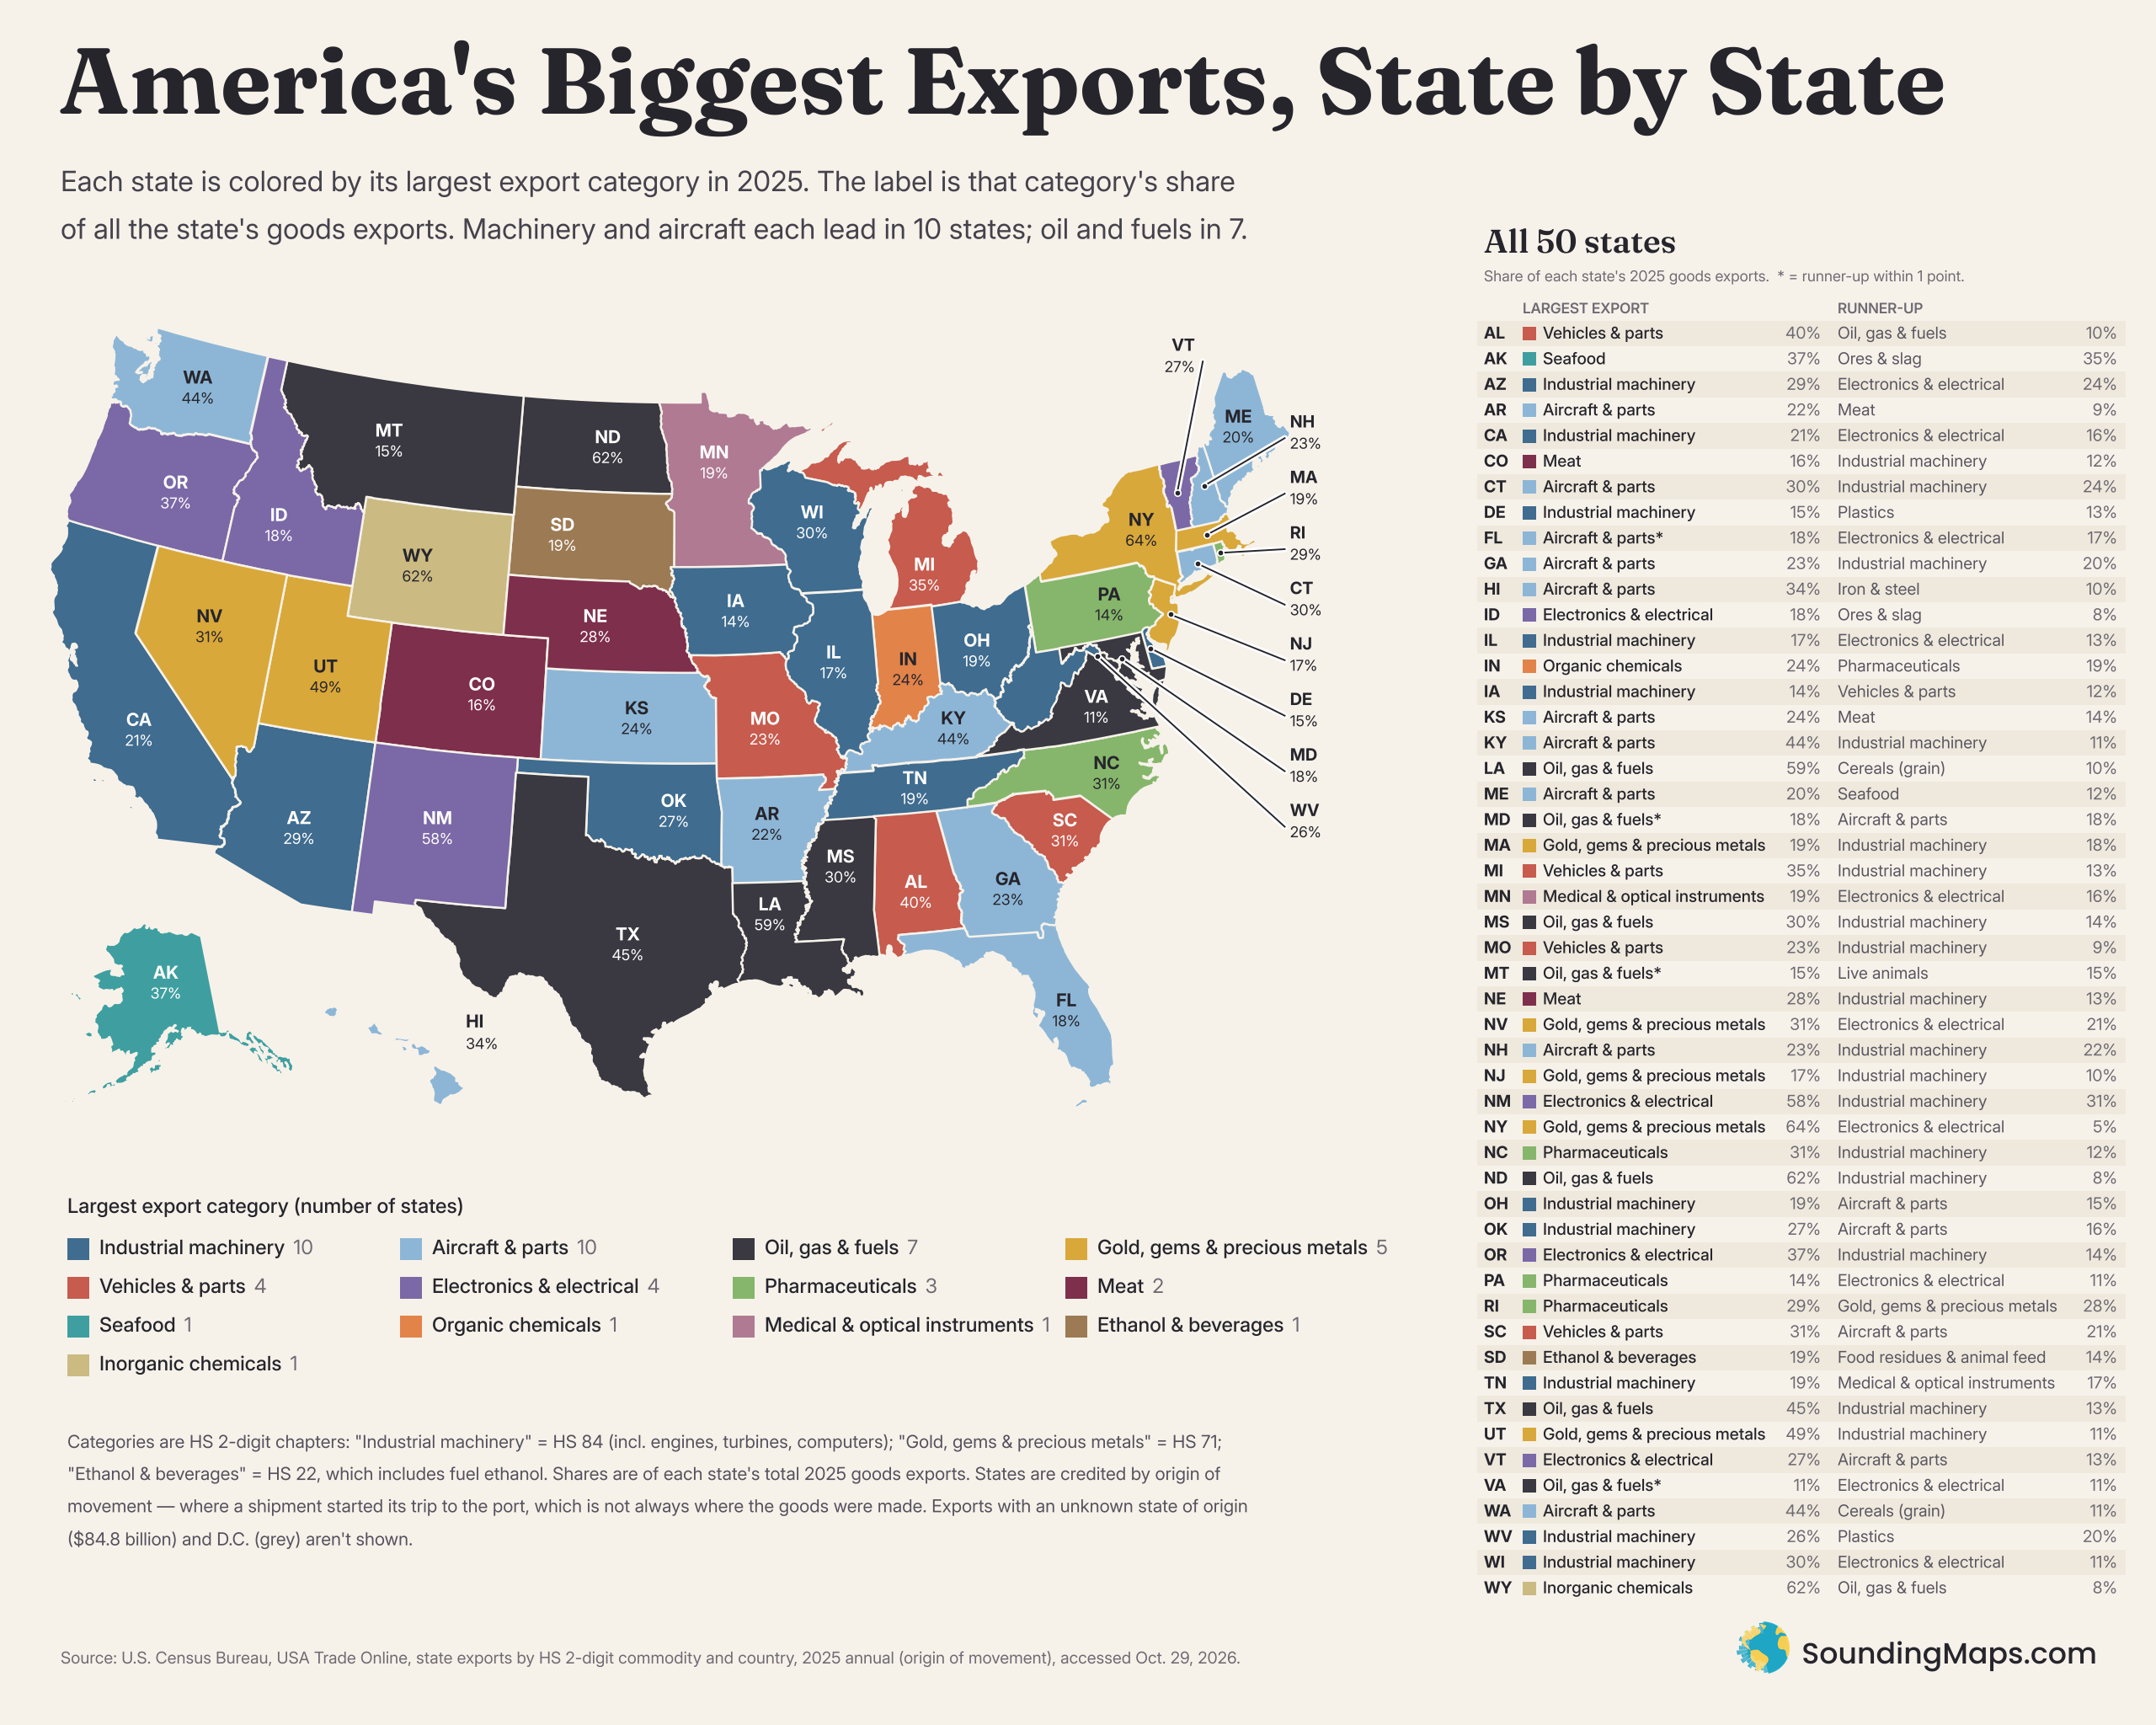
Machinery and aircraft tie for the most common top category, each leading in 10 states. Oil and fuels lead in 7, gold and precious metals in 5, and vehicles and electronics in 4 each. Precious metals make up 64% of New York’s exports, oil and fuels 62% of North Dakota’s, and inorganic chemicals 62% of Wyoming’s (a chapter that includes soda ash, which Wyoming mines in large amounts).
A few states break the pattern:
- Alaska leads with seafood.
- Minnesota leads with medical and optical instruments.
- South Dakota’s top chapter is “ethanol and beverages.” That HS chapter covers fuel ethanol as well as drinks, and more than 99% of it went to Canada.
Where Each State’s Biggest Export Goes
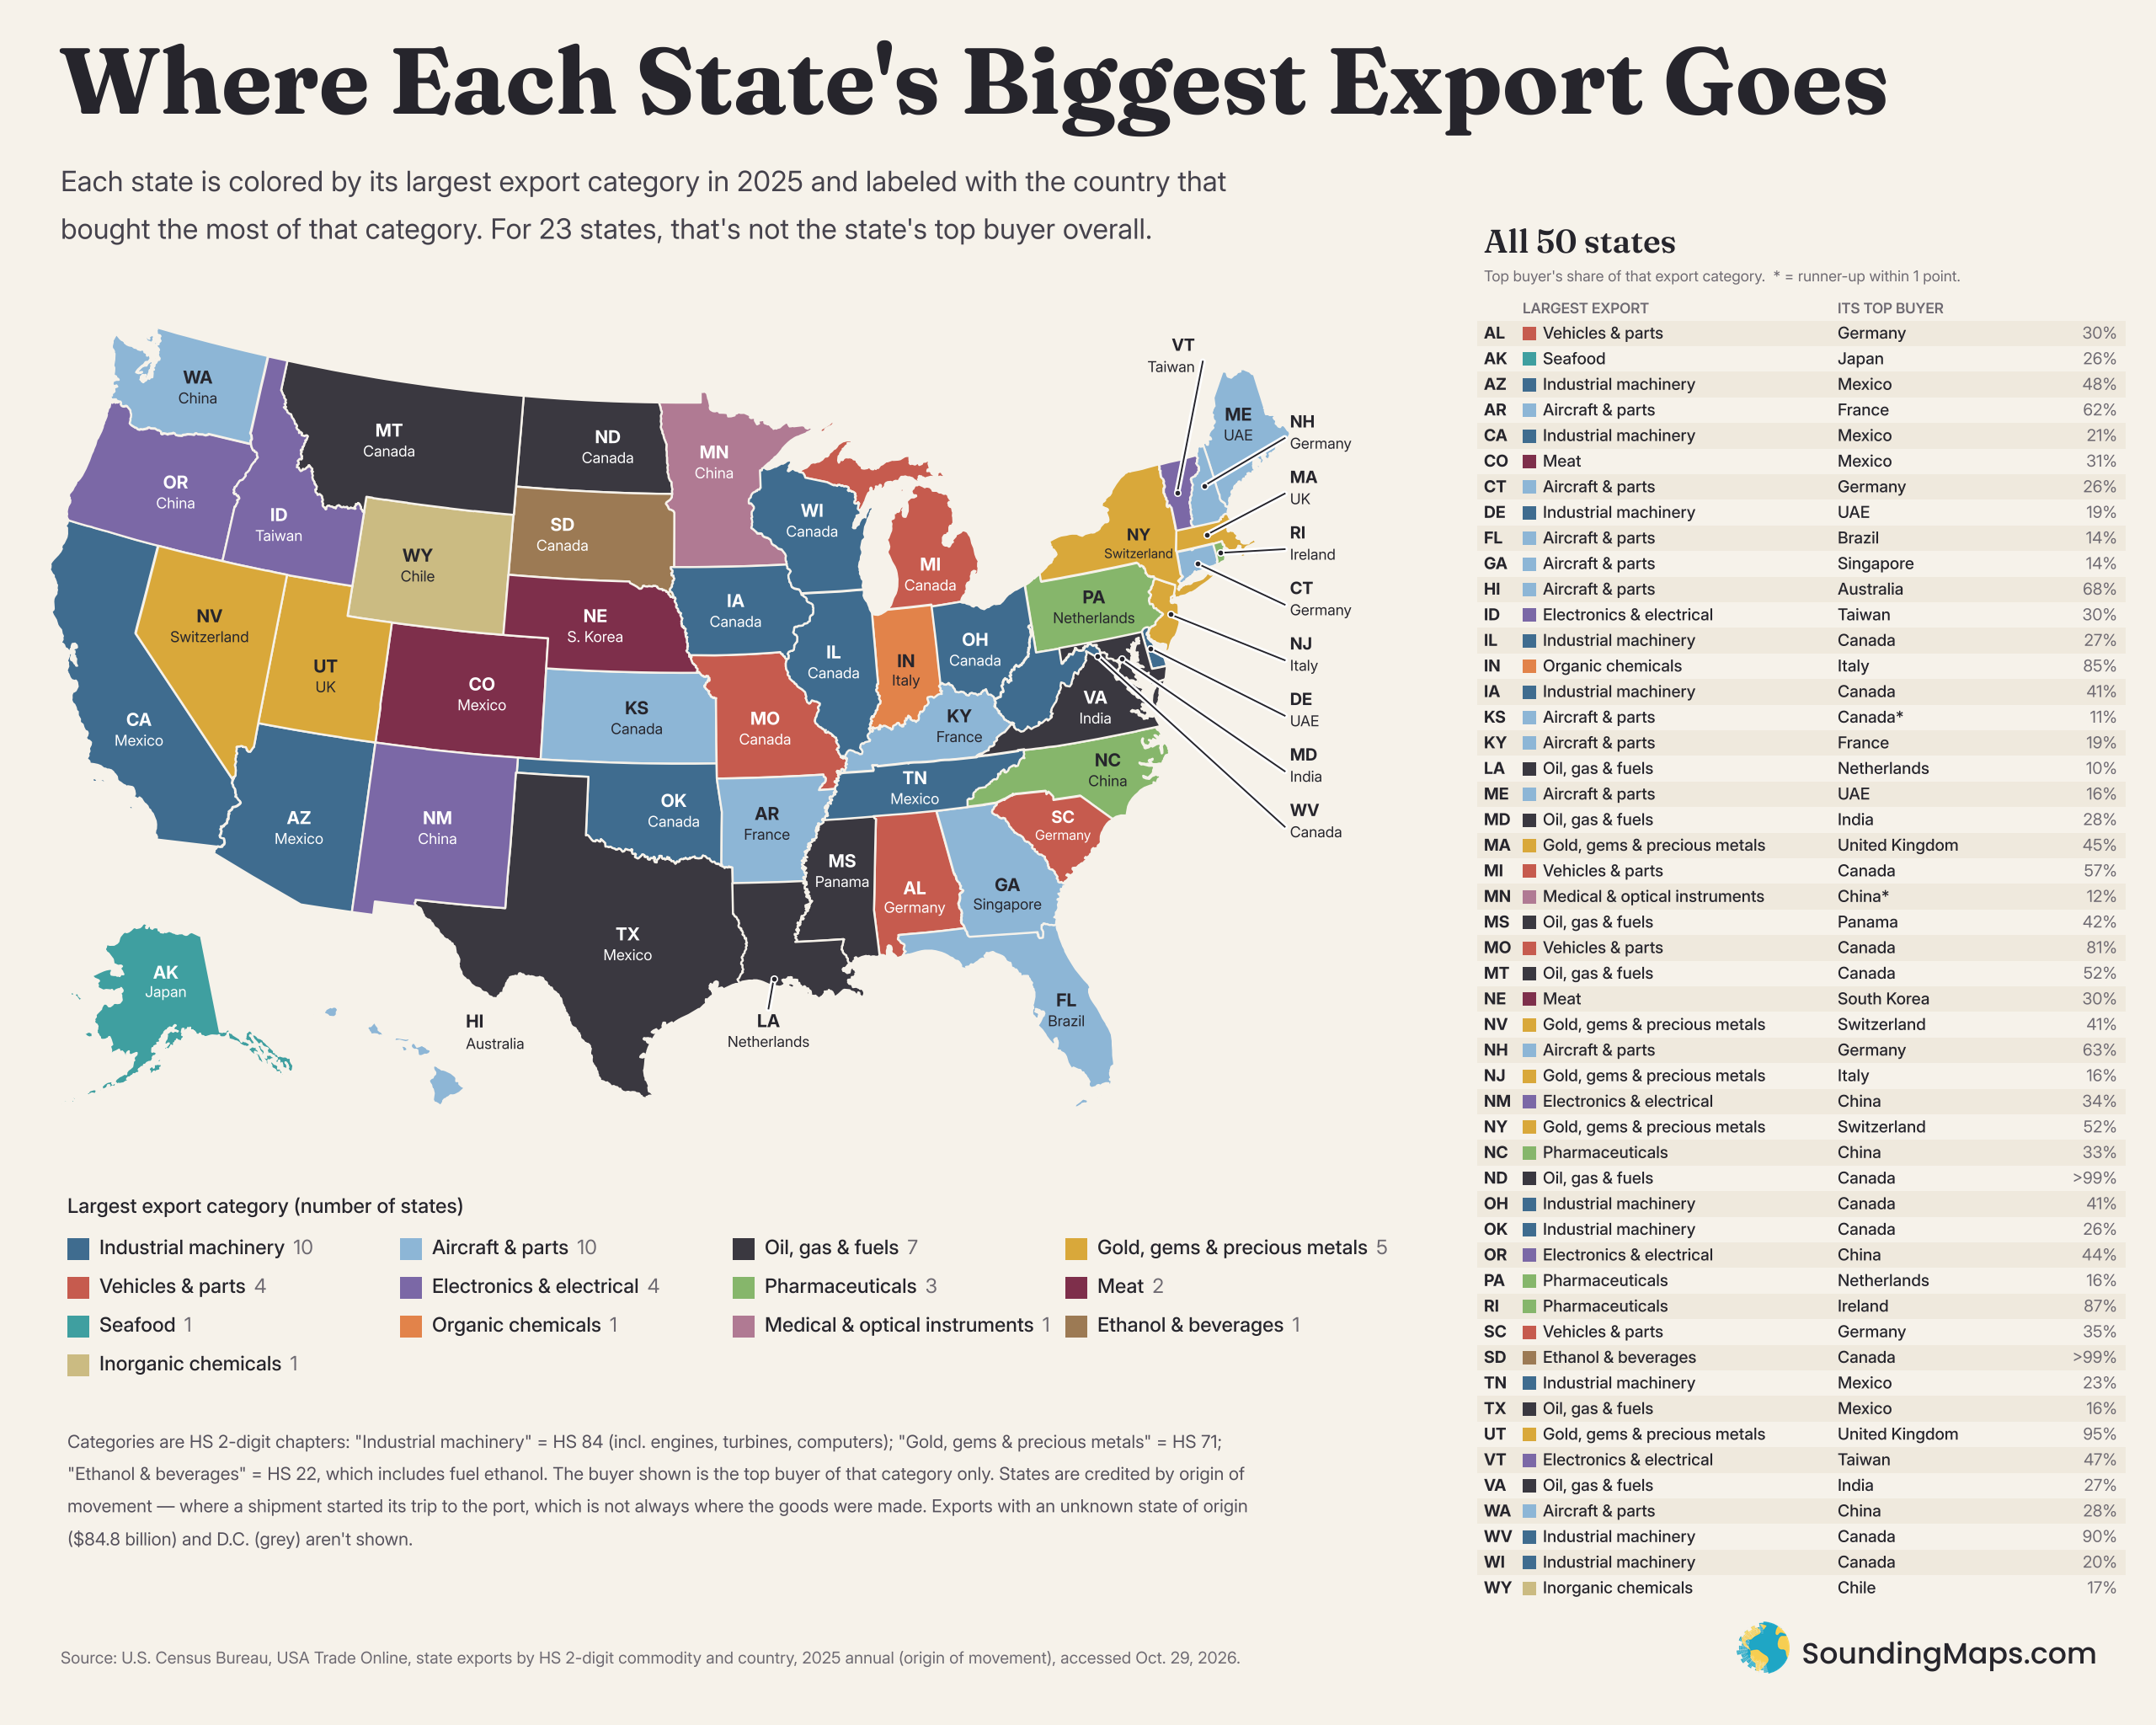
For 23 states, the top buyer of the state’s biggest export isn’t the state’s top buyer overall:
- Alabama’s vehicles go mainly to Germany (30%).
- Arkansas’s aircraft go to France (62%).
- Georgia’s aircraft go to Singapore.
- North Carolina’s pharmaceuticals go to China (33%).
- Nebraska’s meat goes to South Korea.
- Mississippi’s fuels go to Panama (42%).
- Maryland’s and Virginia’s fuels go to India.
Some links are nearly total. Utah’s gold goes to the UK (95%), Rhode Island’s pharmaceuticals to Ireland (87%), and Indiana’s organic chemicals to Italy (85%, about $14.2 billion).
24 years Top Export Animation
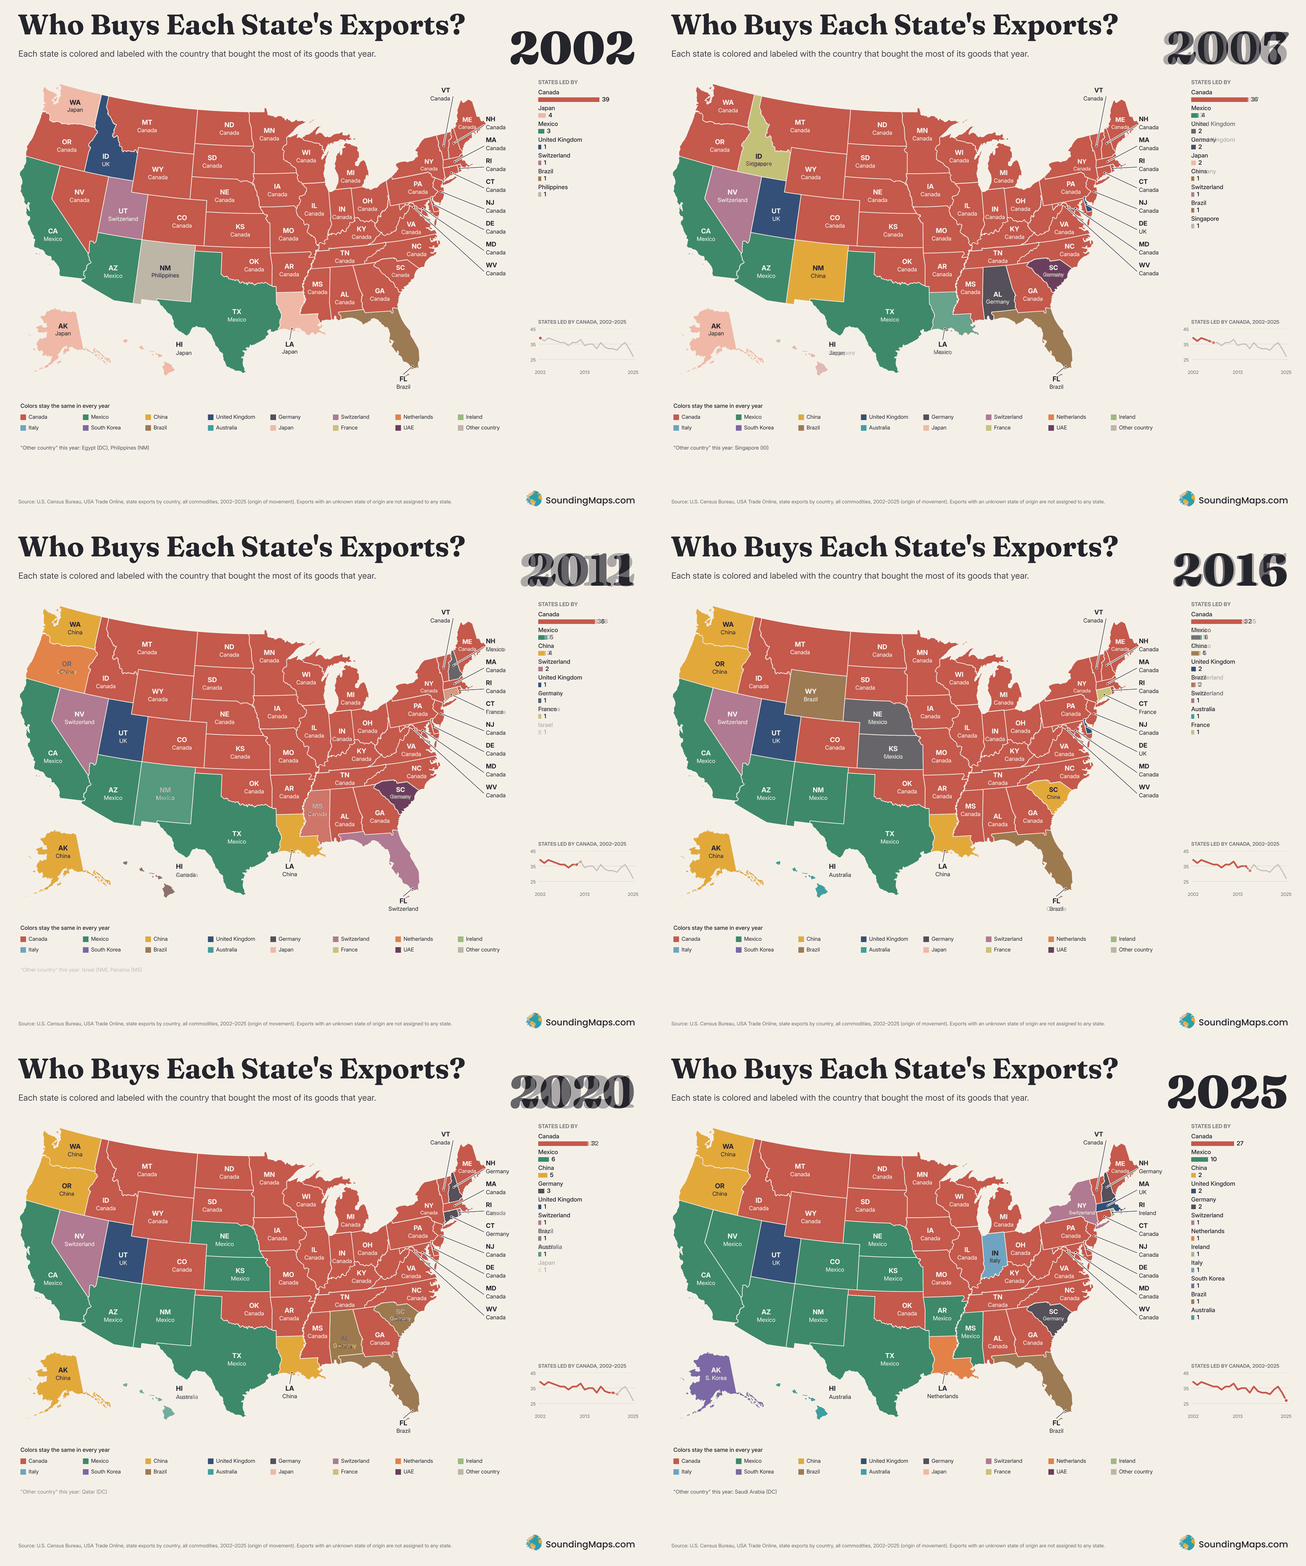
Run the first map back to 2002 and Canada’s dominance looks even bigger. It was the top buyer for 39 states that year, and it stayed in the mid-30s for most of the next two decades. In 2025 it dropped to 27, its lowest count in the 24 years of data. Twenty-one states had Canada as their top buyer in every one of those years.
Mexico grew the other way. In 2002 it led only in its border-state core of Arizona, California and Texas, which never changed. By 2025 it led in 10 states, adding Arkansas, Colorado, Kansas, Mississippi, Nebraska, Nevada and New Mexico. Most of that spread came after 2015. Kansas and Nebraska first flipped to Mexico in 2016, and Mexico’s count went from 6 in 2023 to 9 in 2024 and 10 in 2025.
China’s rise came earlier. China first appears as a state’s top buyer in 2006, and by 2009 it led for Washington, Oregon and Louisiana. It reached five states in 2013 and hovered between three and five through 2024. It slipped to two states in 2025, Washington and Oregon. Japan moved the other way: it was the top buyer for Washington, Alaska, Louisiana and Hawaii in the early 2000s and has since dropped to one state or none in most years.
Some states never sit still:
- South Carolina and Hawaii changed top buyers more than any others, 11 times each. South Carolina rotates among Canada, Germany and China. Hawaii trades among Japan, Australia, South Korea and others on small, lumpy totals.
- Utah’s top buyer has been the UK almost every year since 2005, apart from two Hong Kong years (2013–2014). Utah exports mostly gold.
- Florida turned Swiss from 2010 to 2012, then went back to Brazil.
- Indiana had Canada as its top buyer for 23 straight years, then flipped to Italy in 2025. Its exports to Italy jumped from about $1 billion in 2022 to $3.2 billion in 2023, $6.5 billion in 2024 and $14.8 billion in 2025.
Treat single-year flips with caution. In 78 of the 1,200 state-years, the runner-up was within one percentage point of the leader. A color change in the animation can mean a near tie that tipped, not a big shift in trade.
Methodology and sources
All data comes from the U.S. Census Bureau’s USA Trade Online, “State Exports by HS Commodities,” total exports value (origin of movement), accessed October 29, 2026. Census credits exports to the state where a shipment began its trip to the port, which is usually, but not always, where the goods were made.
2025 maps:
- Annual 2025 data by state, country and HS 2-digit chapter.
- It arrived in two files covering different states. We confirmed they didn’t overlap and that every state, country and chapter appeared once.
- USA Trade Online lists Yemen twice with identical values, so one copy was dropped.
- Results were recomputed a second way from the raw files.
- State totals match the Census FT-900 state table within 1% for 42 of 50 states, and within about 5% for the rest, consistent with later revisions.
- Map 1 uses all products combined. Map 2 uses the largest HS 2-digit chapter, with shortened names (“Industrial machinery” is HS 84, including engines, turbines and computers). Map 3 shows the top buyer of that one chapter only.


