
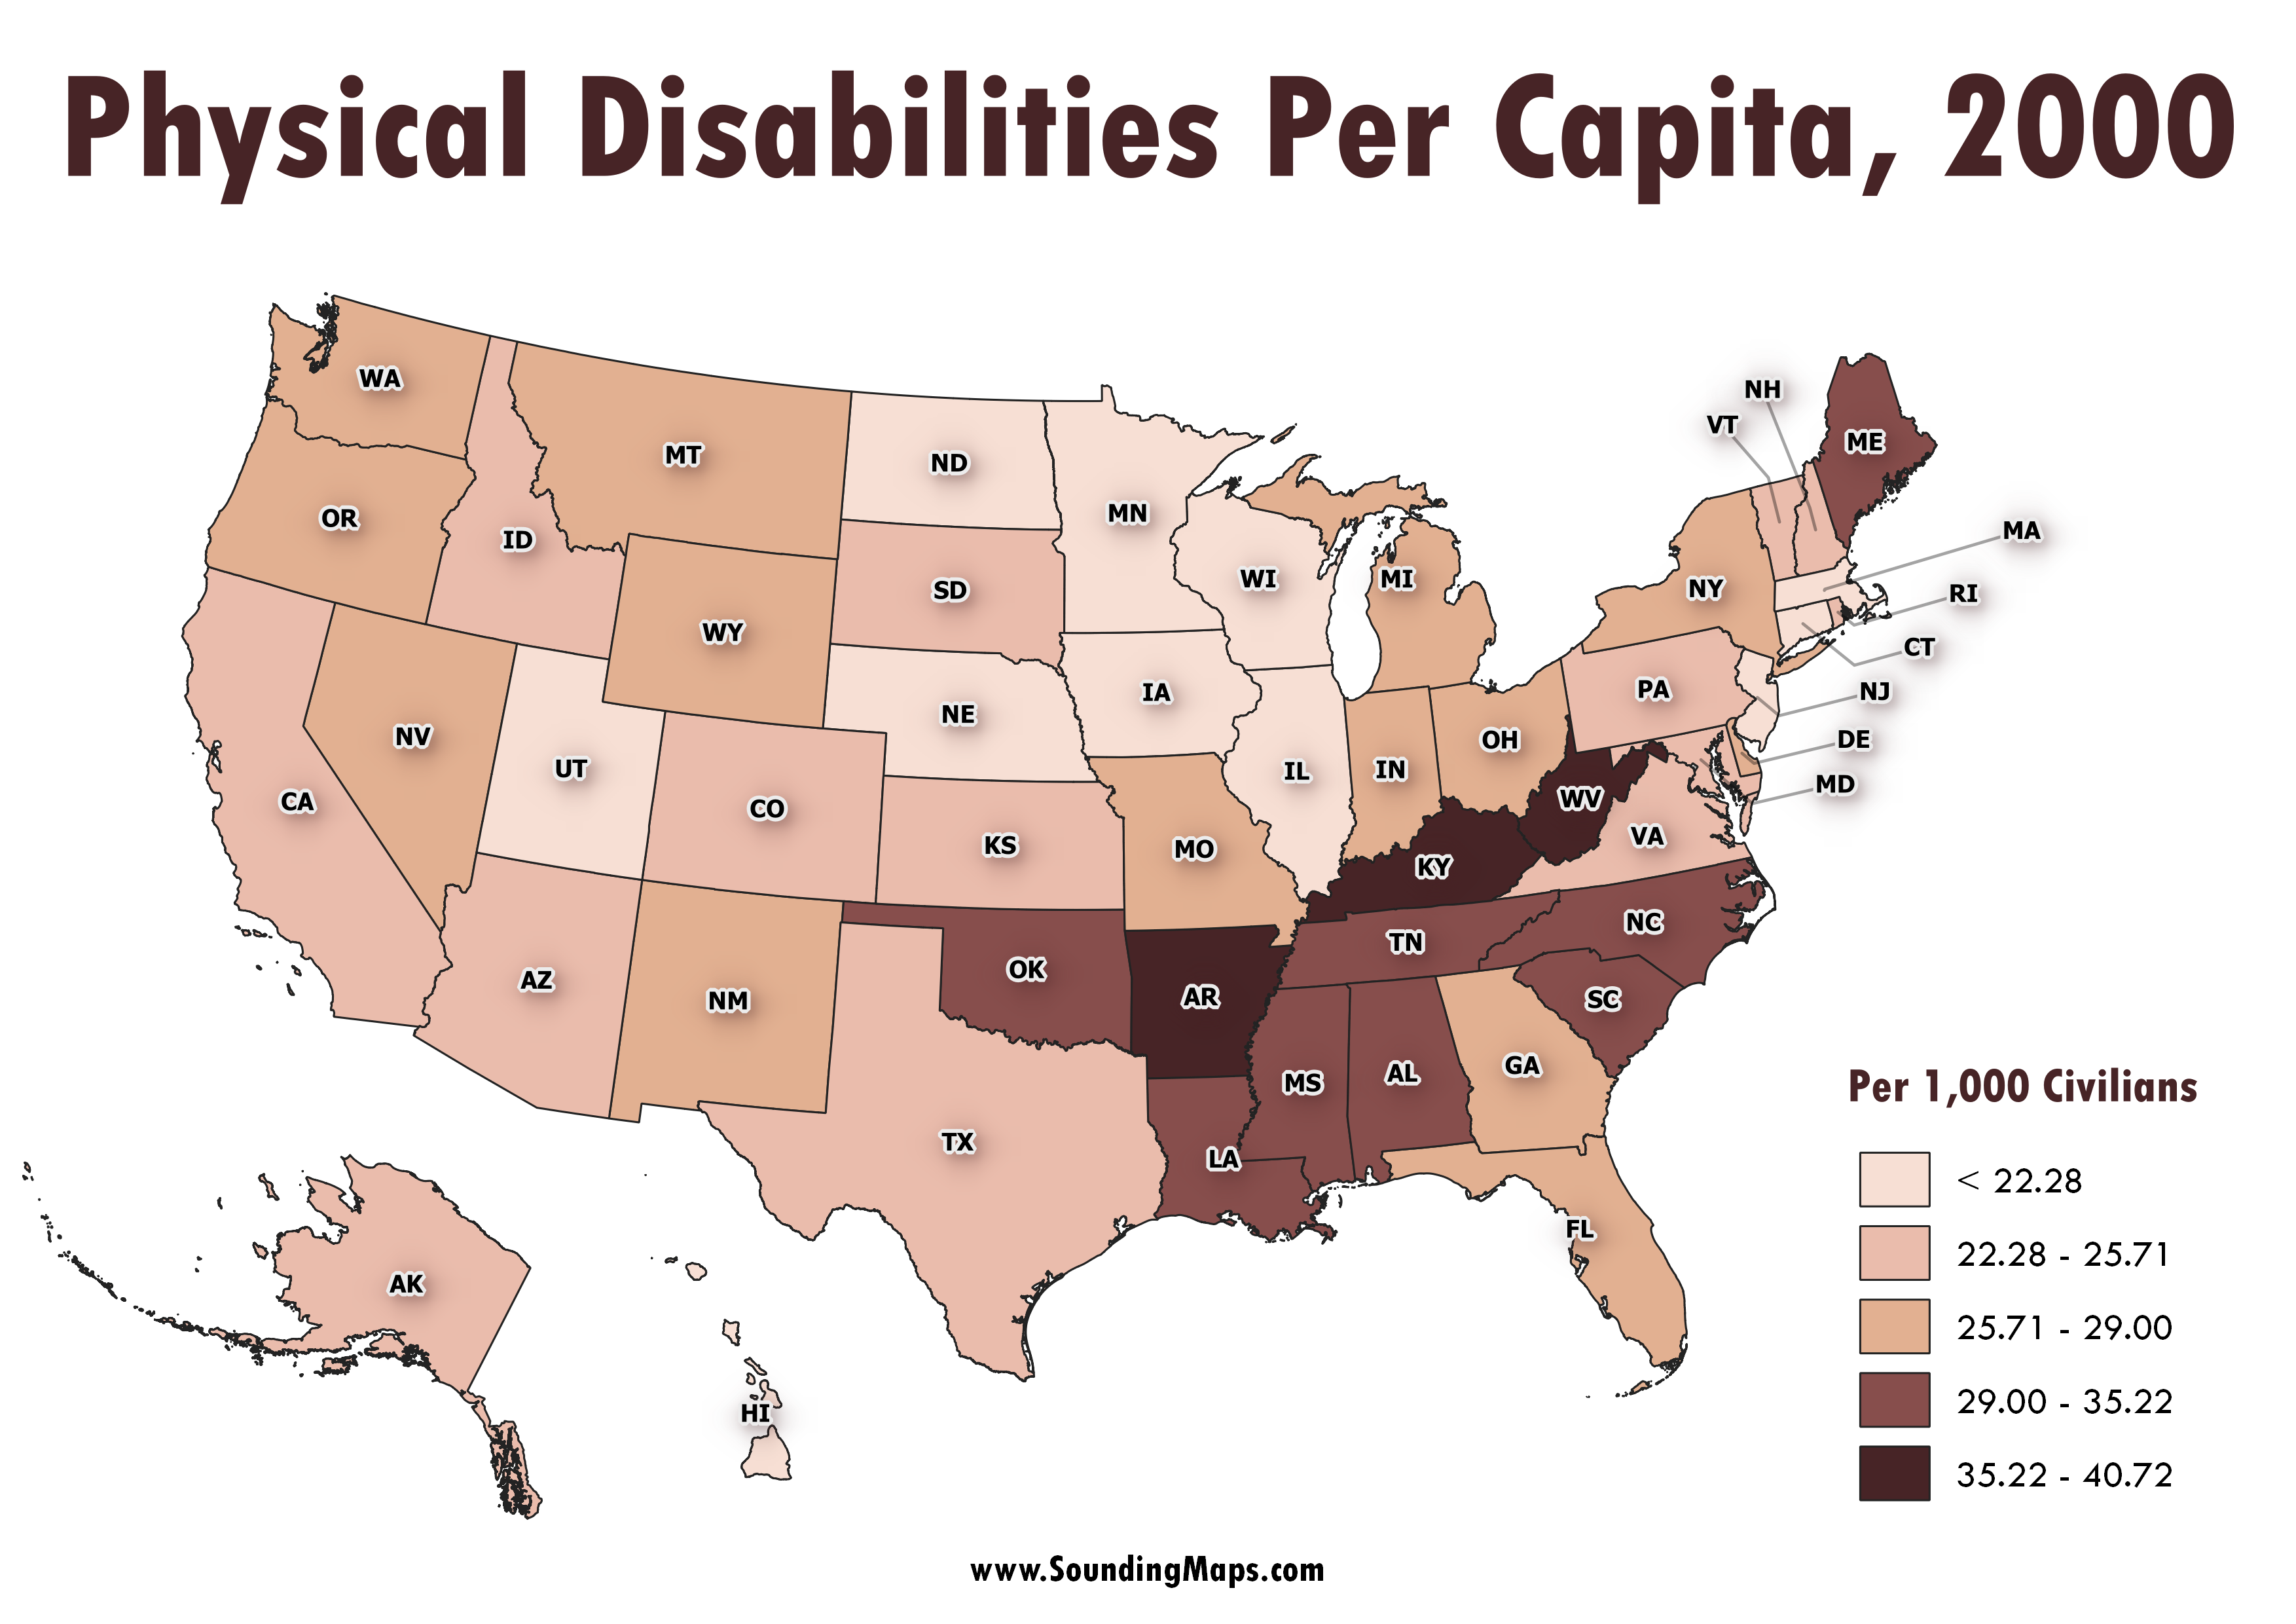
Physical disabilities USA! This map reveals the cluster of states with high rates of physical disabilities measured per capita. Turns out, the concentration take holds in the South Eastern United States. Census 2000, marking the turn of the millennia, surveyed disability status’ of Americans. The total count of a person […]
Monthly Archives: June 2019
4 posts

The Year of African Independence Dates This map shows each African nation’s independence dates. 1960 is referred to as The Year of Africa, mainly because of the independence of seventeen African countries. Most gained independence from Belgium, France, and the United Kingdom. Following most African colonization between 1880 and 1900, the struggle […]
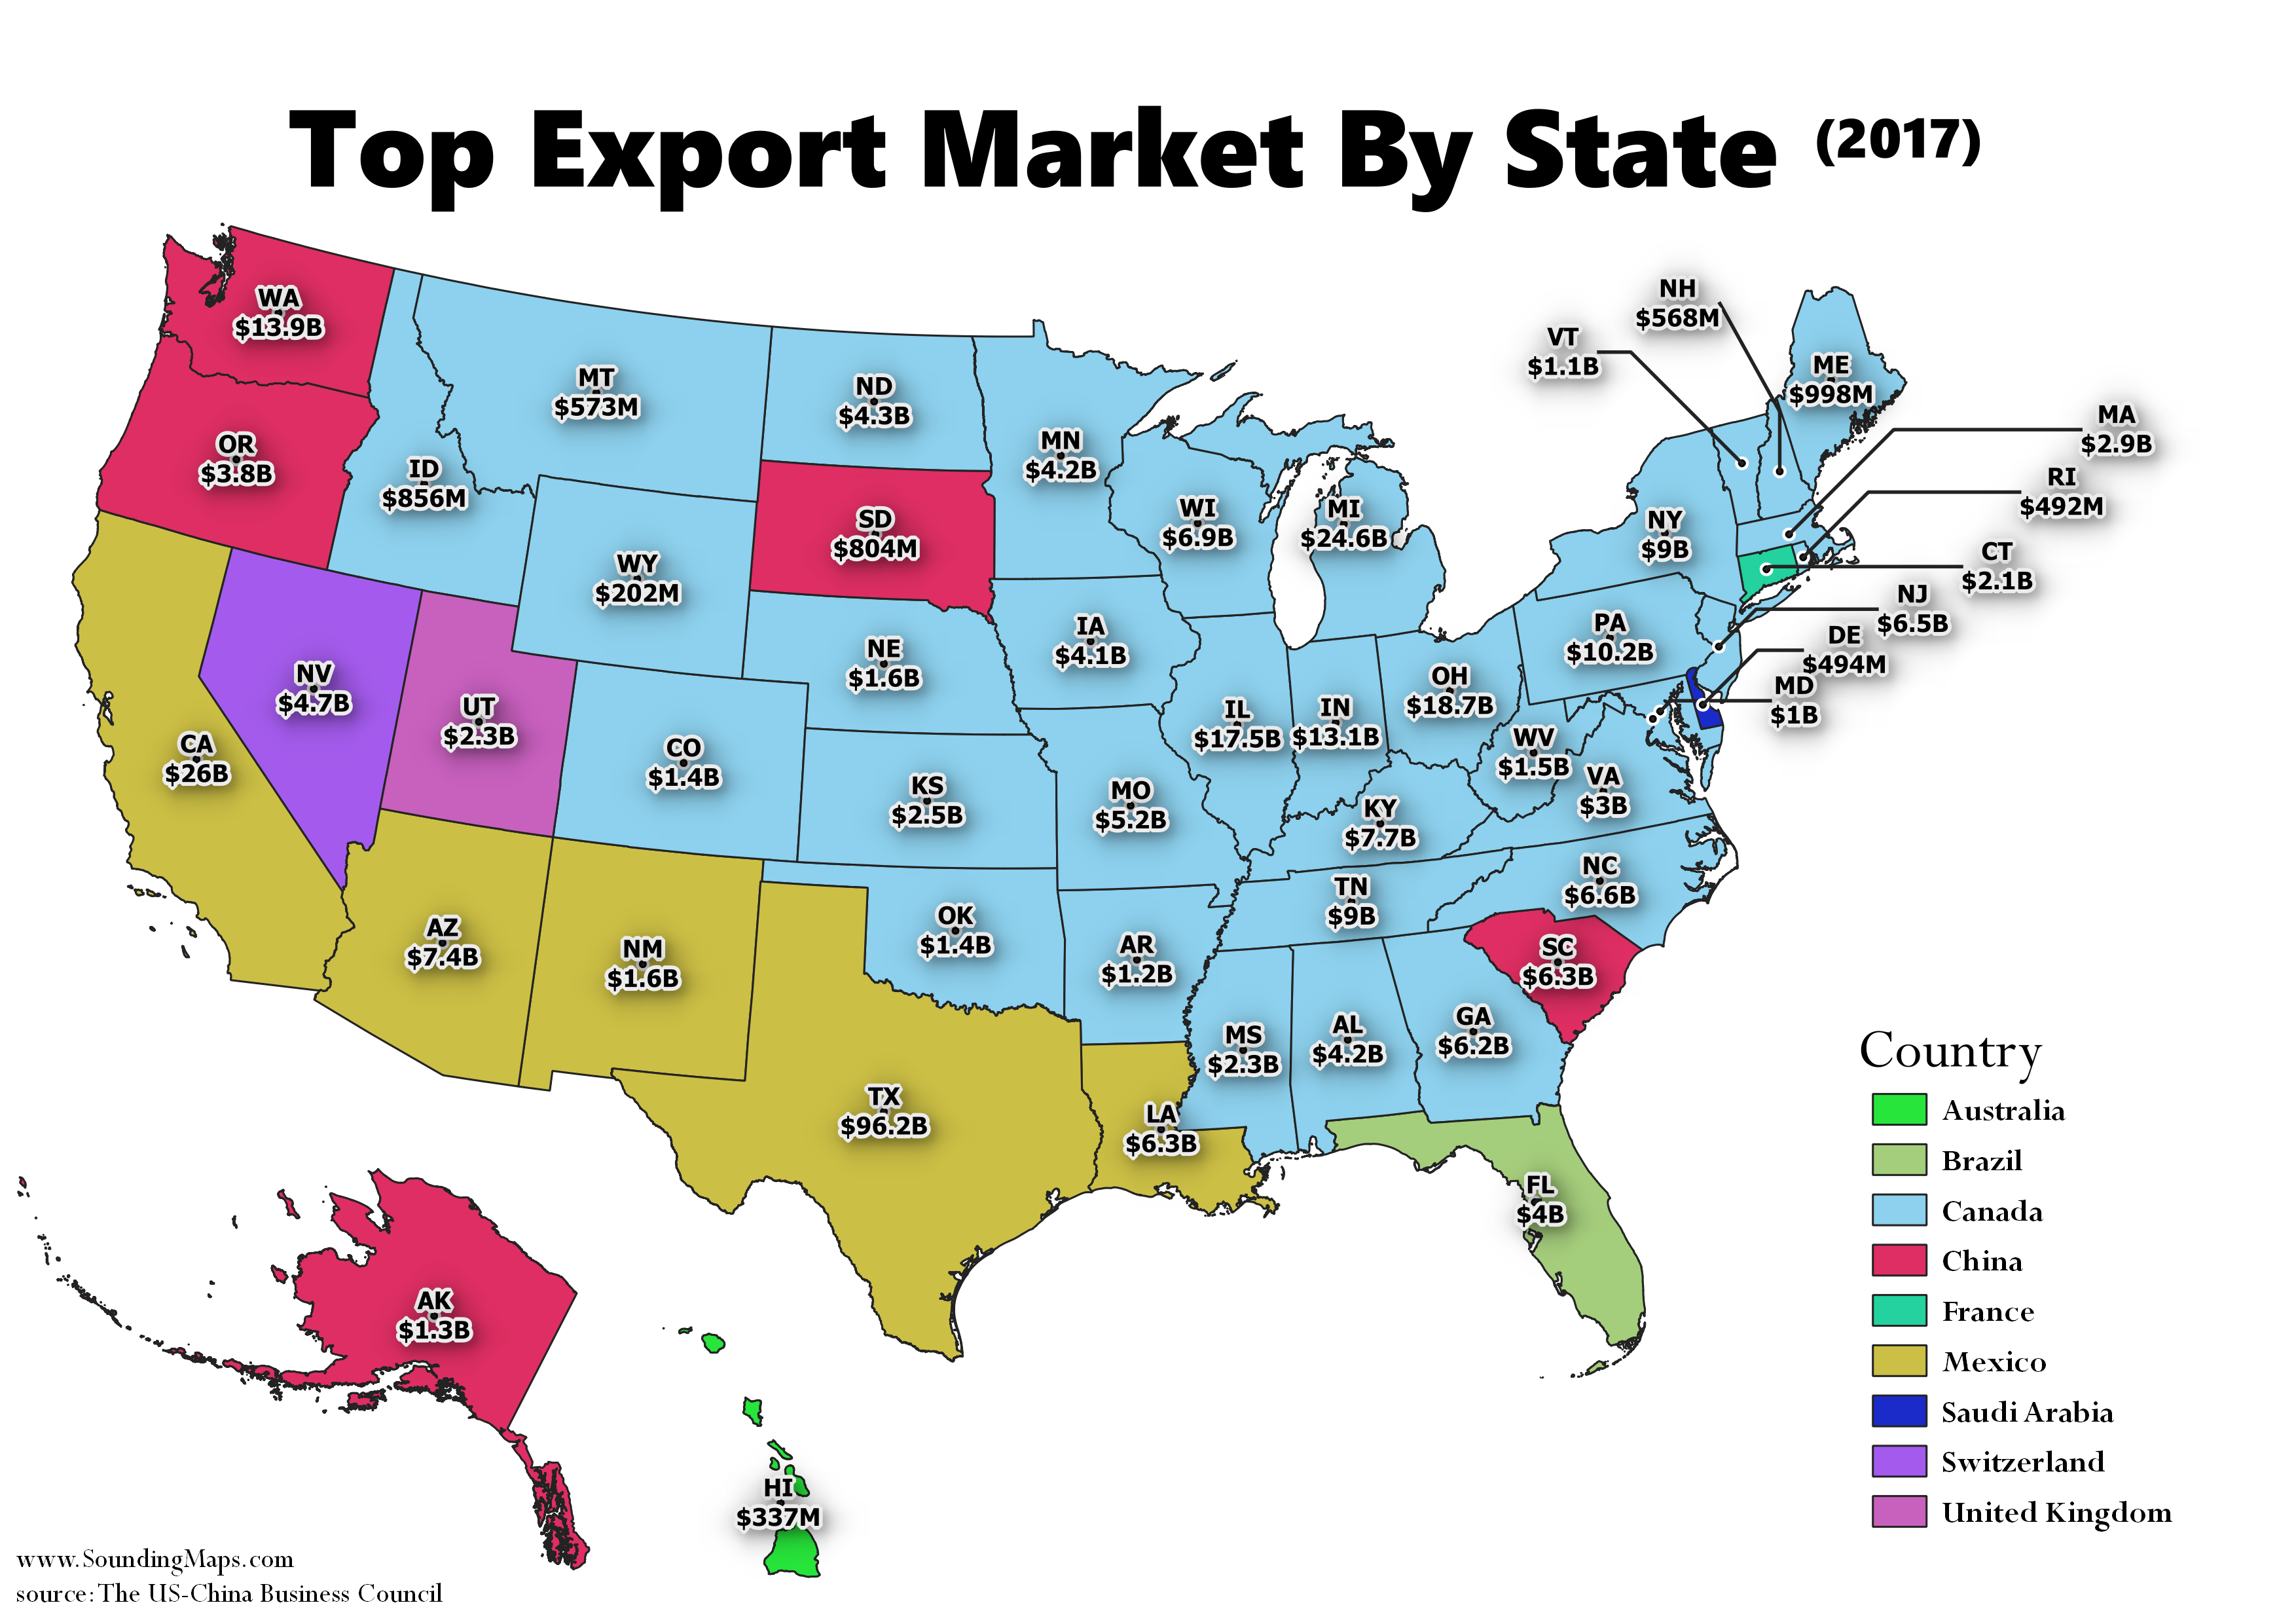
This map shows the United States biggest export markets for each state. In 2017, Canada was the United States biggest export market for 33 states, and exports to Canada across the country totaled $282.3 billion. Both China and Mexico are the top export market for 5 states. The top exports to […]
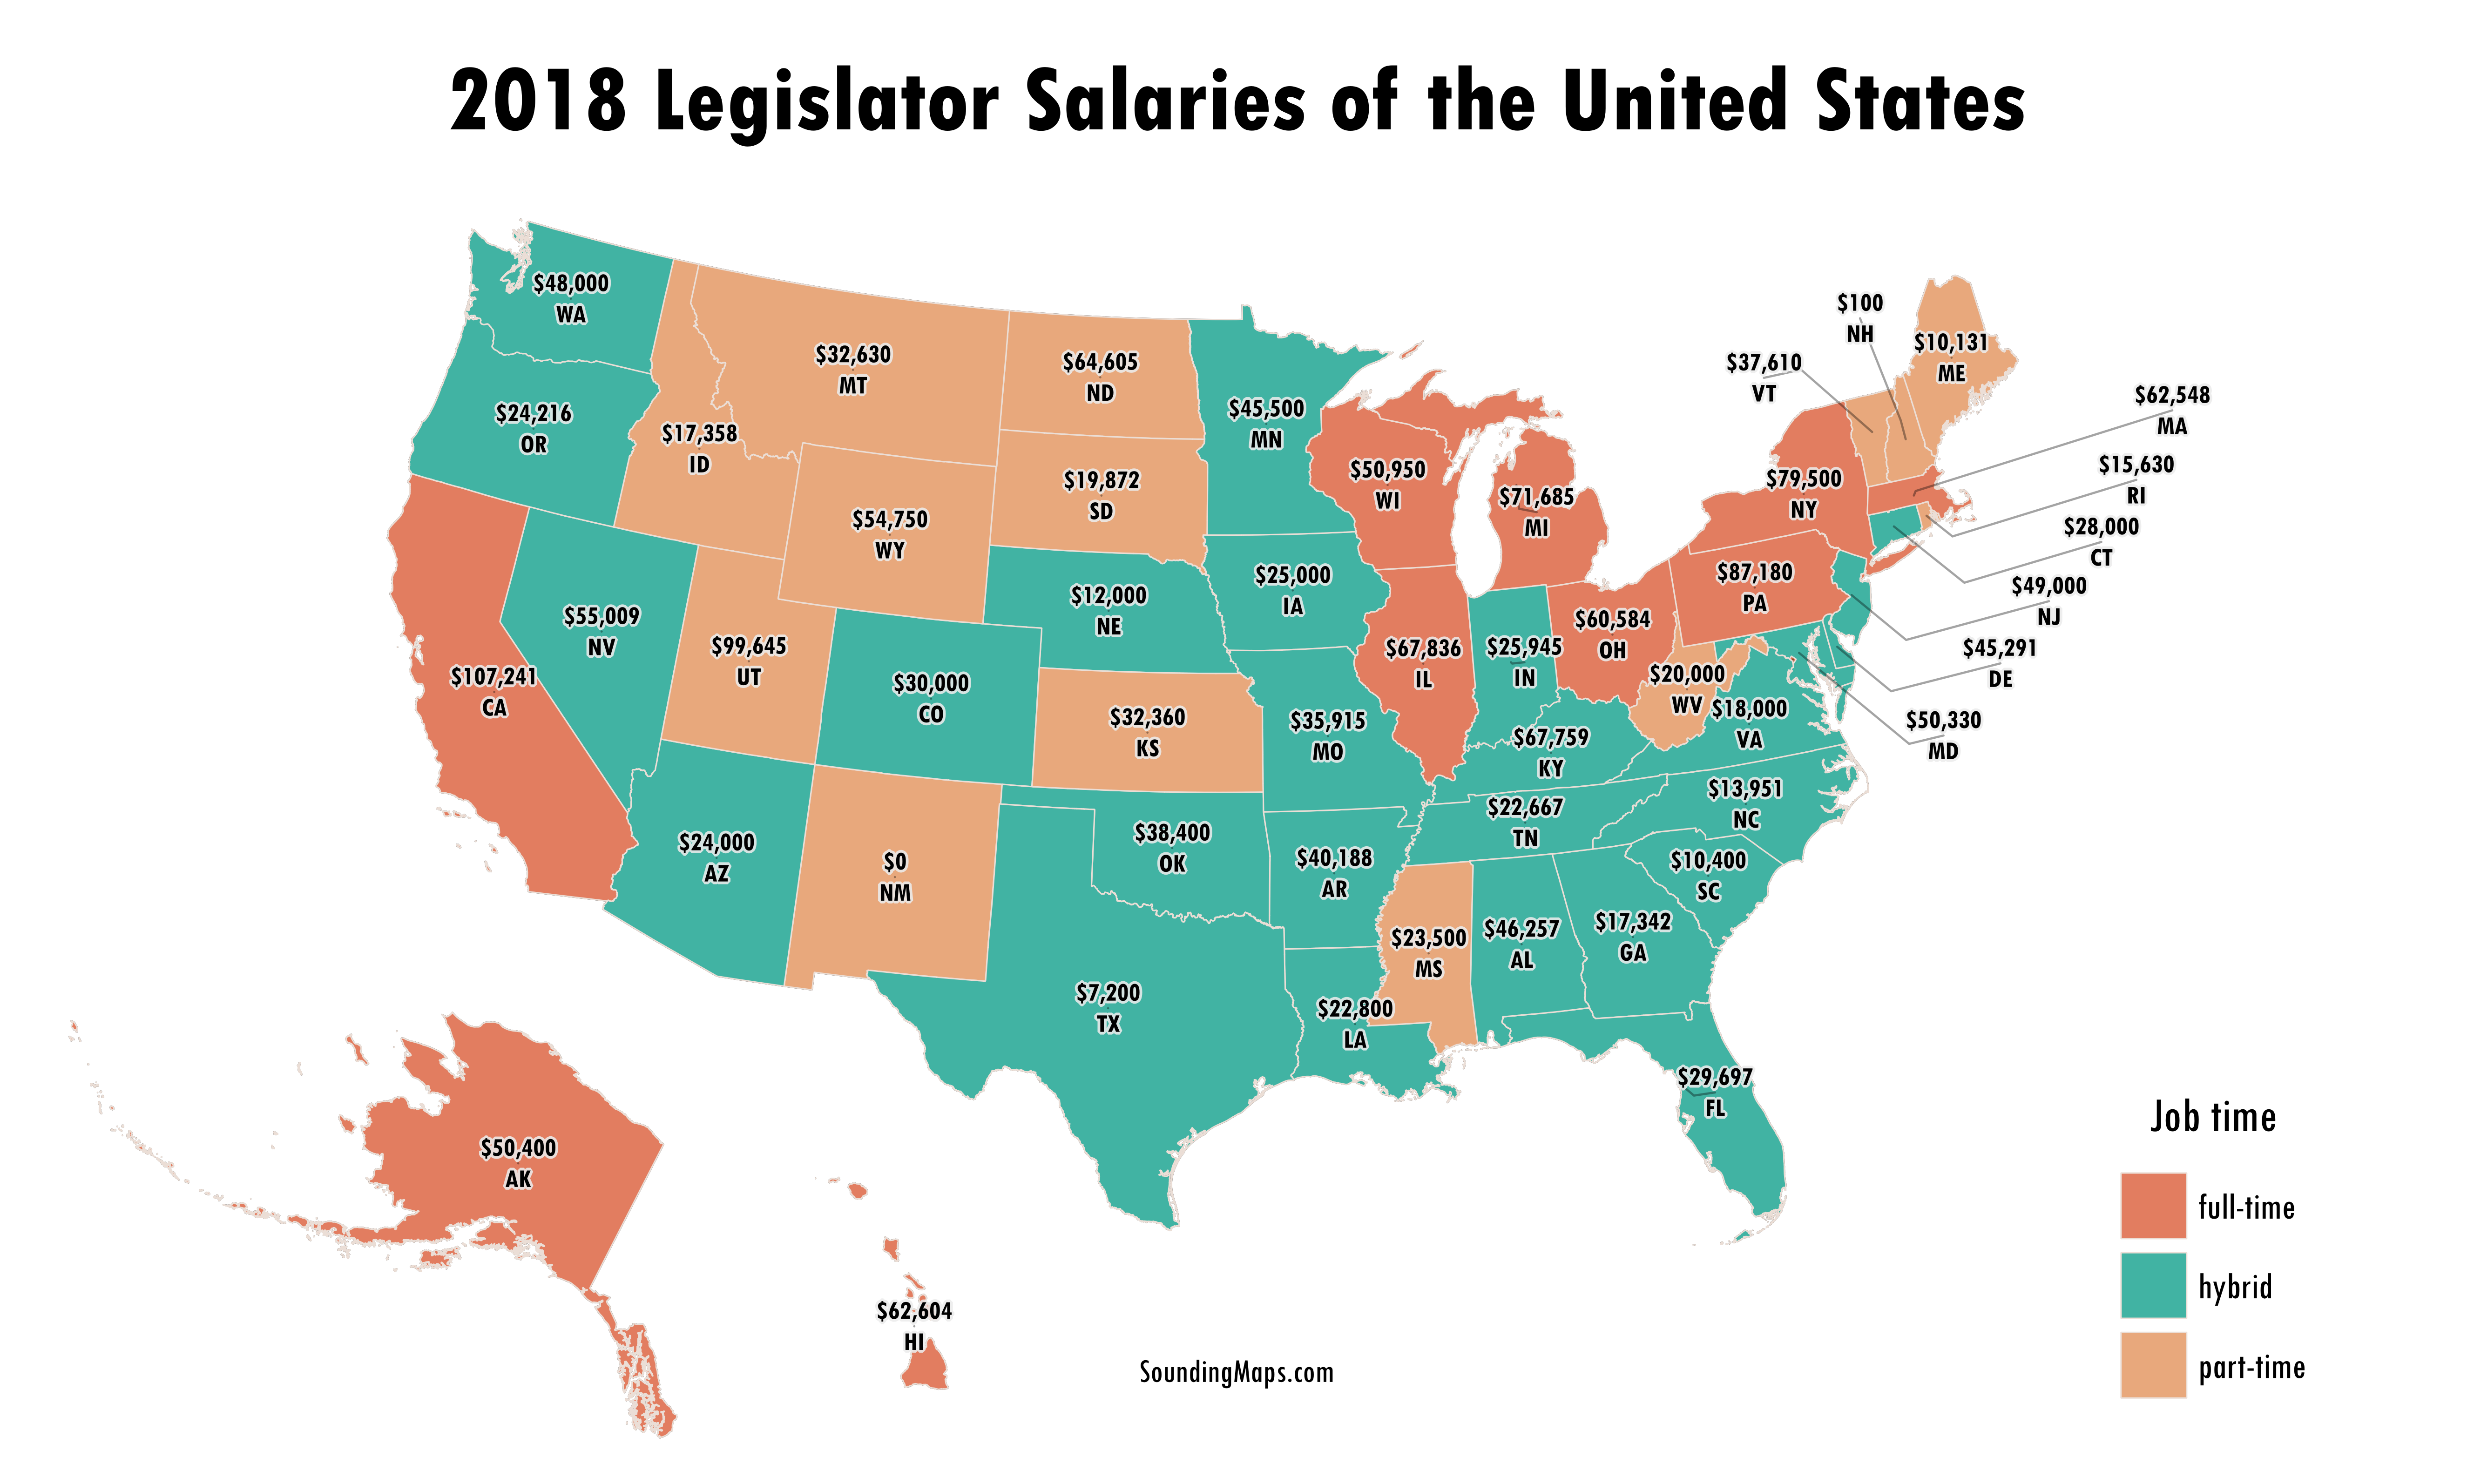
Have you wondered what your state legislators make for a salary? Ever care to think what the people making your laws are paid? To be honest, not really. Although I was a bit surprised to learn the amounts. This map shows various US legislator salaries including senators and representatives. There […]