

Now, categorized by operating revenue, this is the 2018 North American biggest railroads map. The USA rail network is dominated by 5 railroad companies. Read below to see how the 2022 railroad revenue’s compared. The Largest US Railroads Union Pacific is mapped in pink throughout the western United States against […]
Monthly Archives: April 2019
4 posts
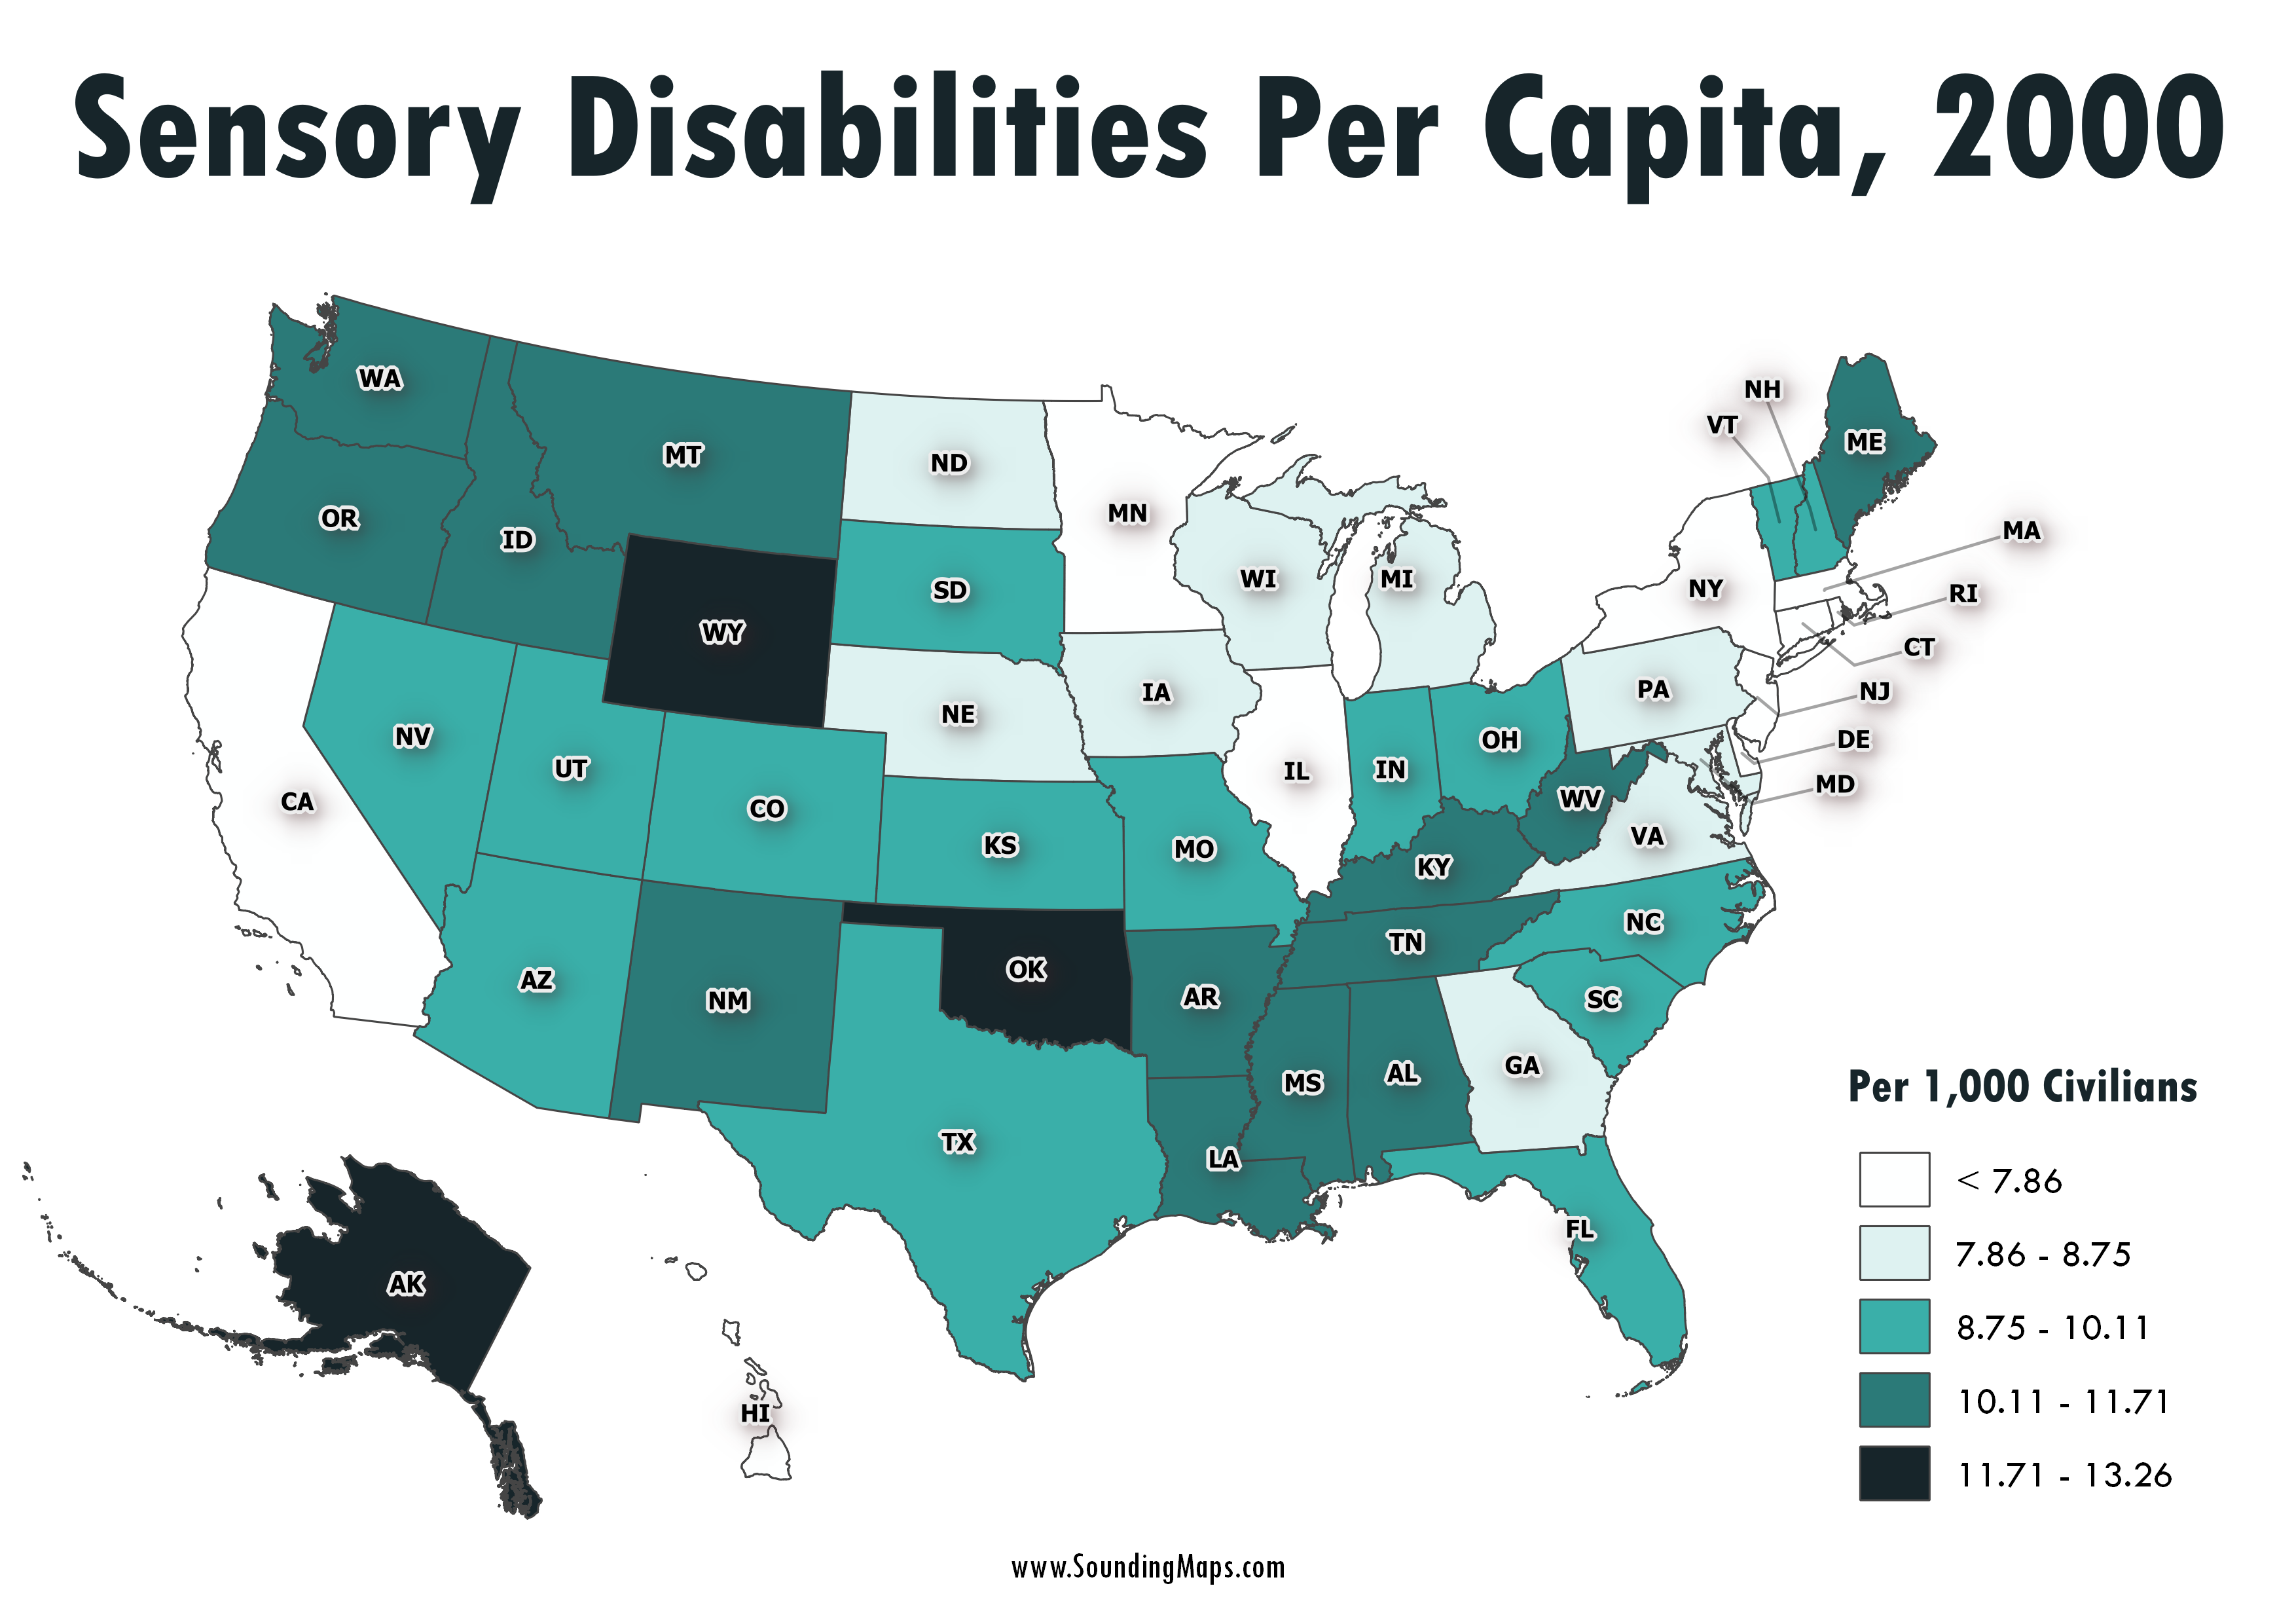
This map shows sensory disabilities throughout the United States in the year 2000. The color coded regions represent disabilities per 1,000 civilians. For instance, Alaska had 12.26 sensory disabilities per 1,000 citizens. Census 2000 counted 49.7 million people with some type of long lasting condition or disability. They represented 19.3 […]
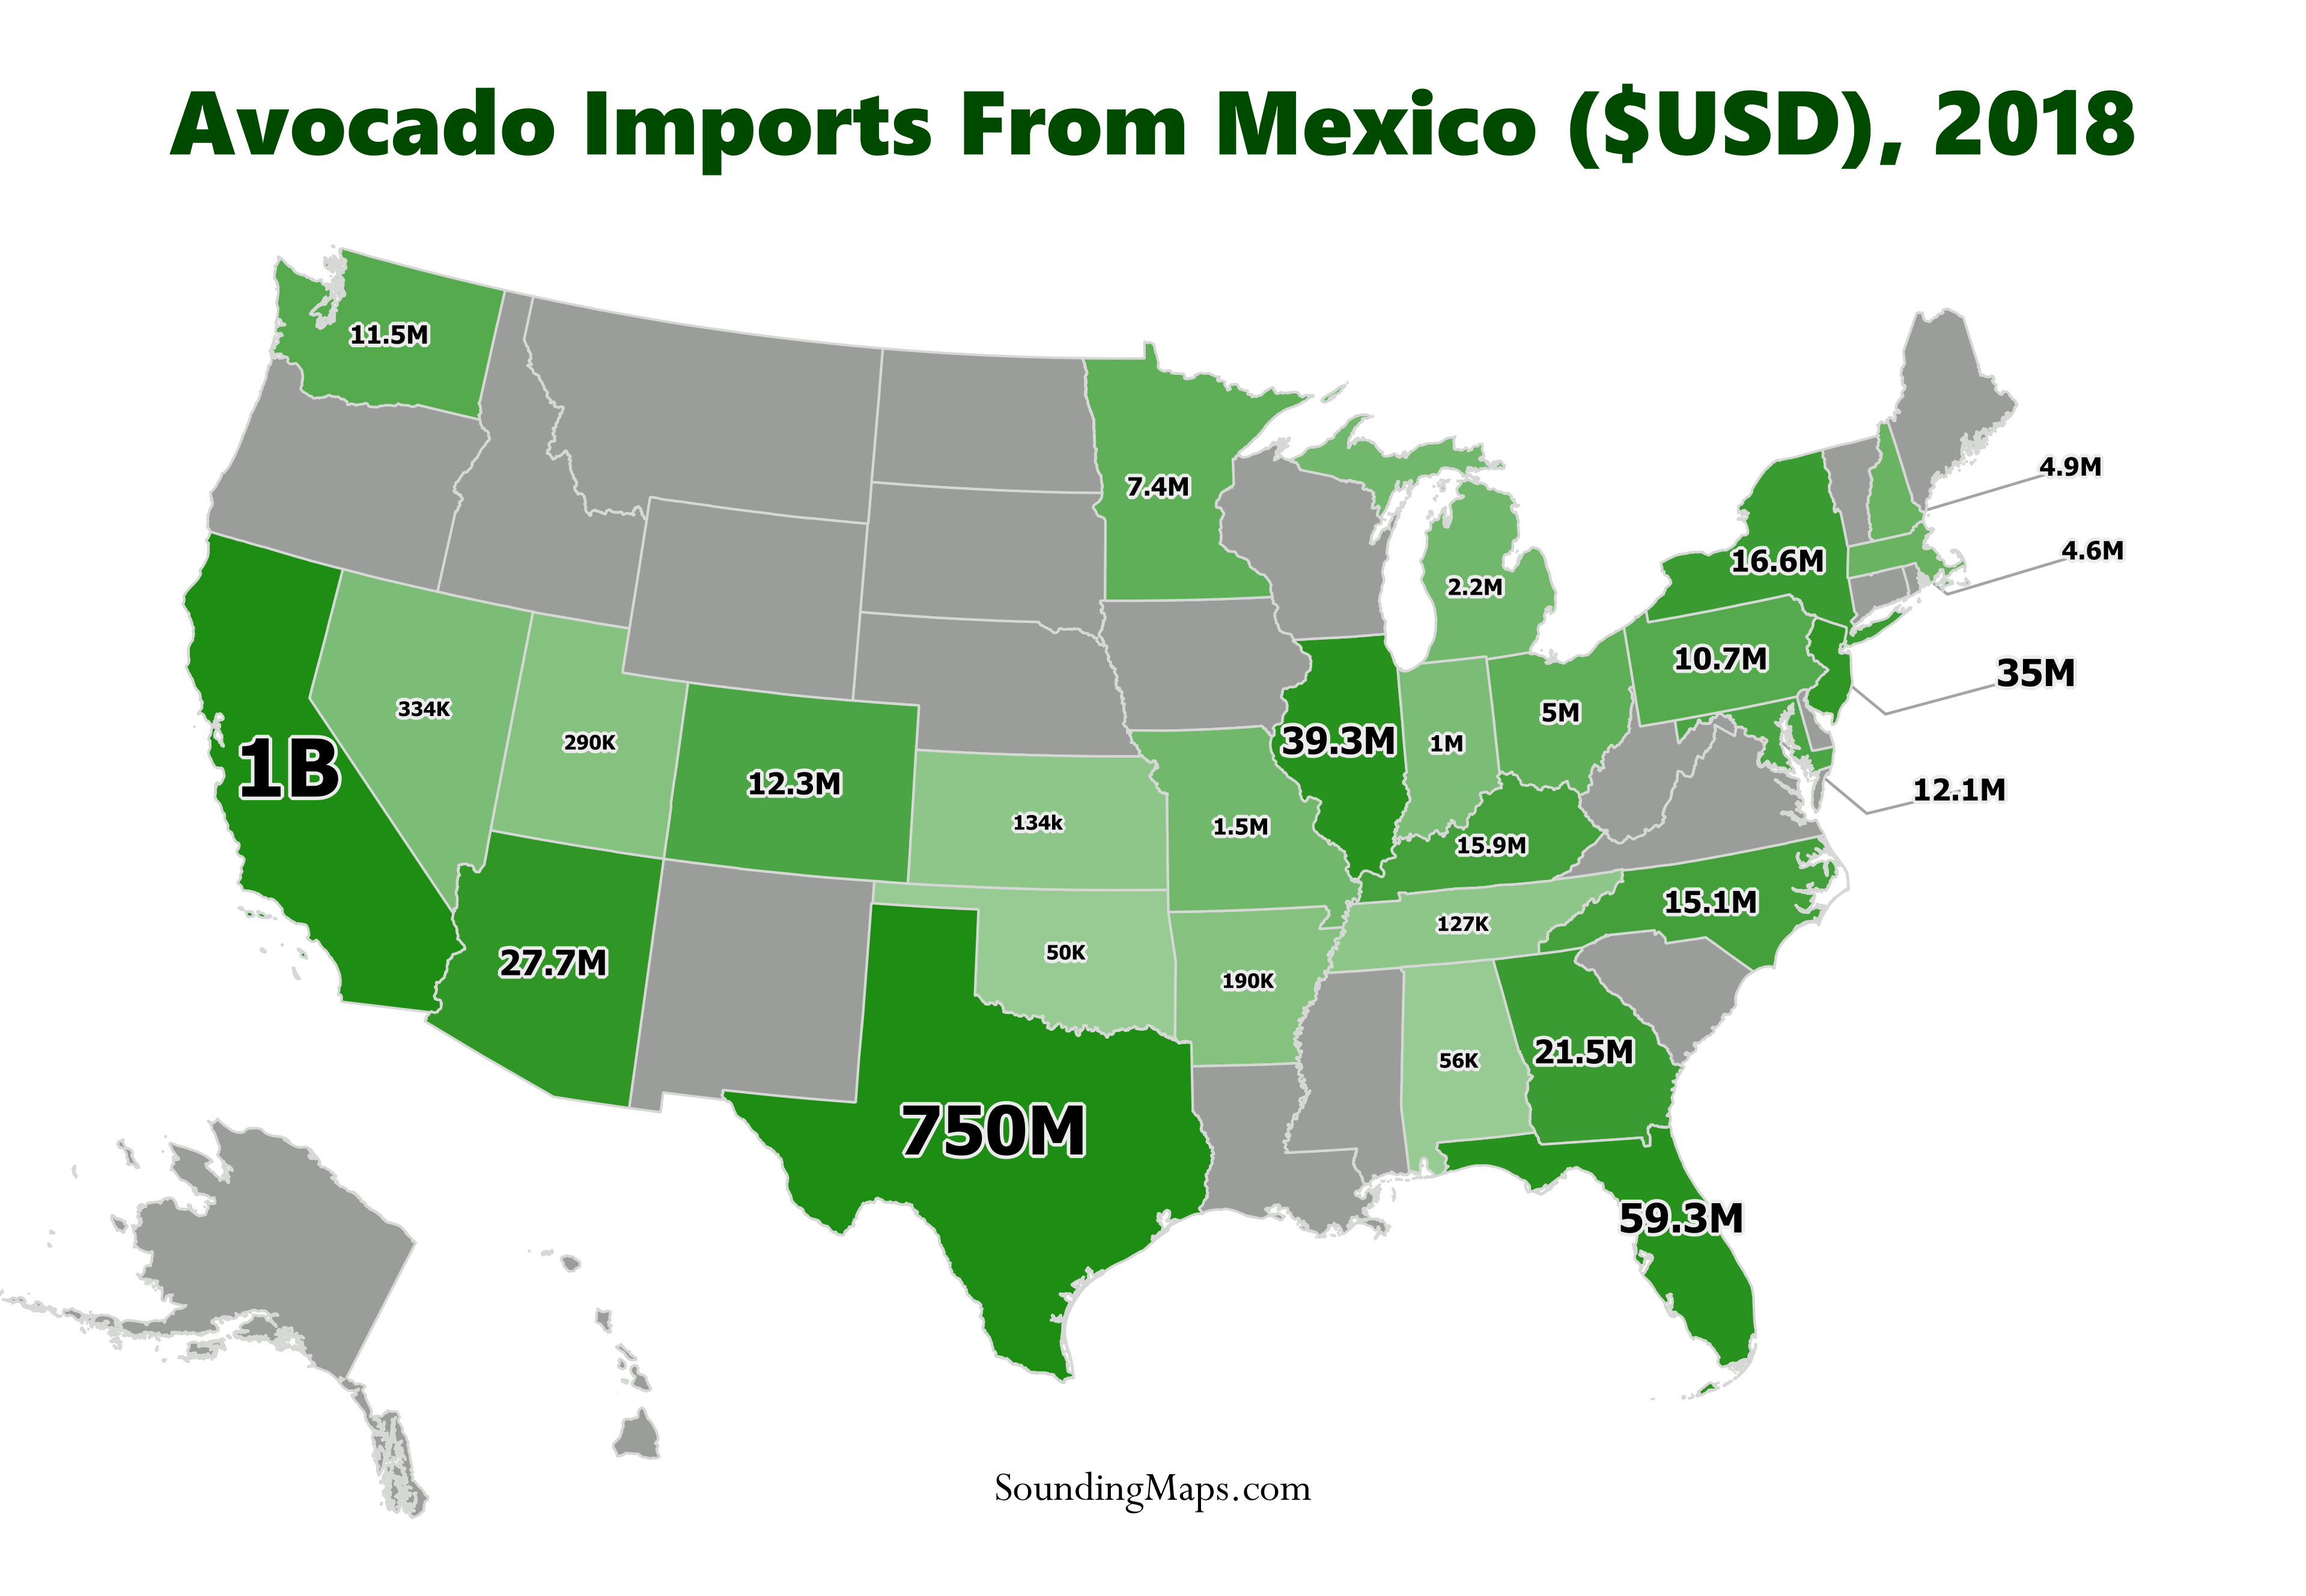
In light of Trump’s threats to close down the border and his recent retaliation of extending his trade war by threatening to impose tariffs against Mexico, this map demonstrates the impact of US avocado imports against Mexico. In 2018, the avocado imports from Mexico generated the country approximately $3 billion. […]
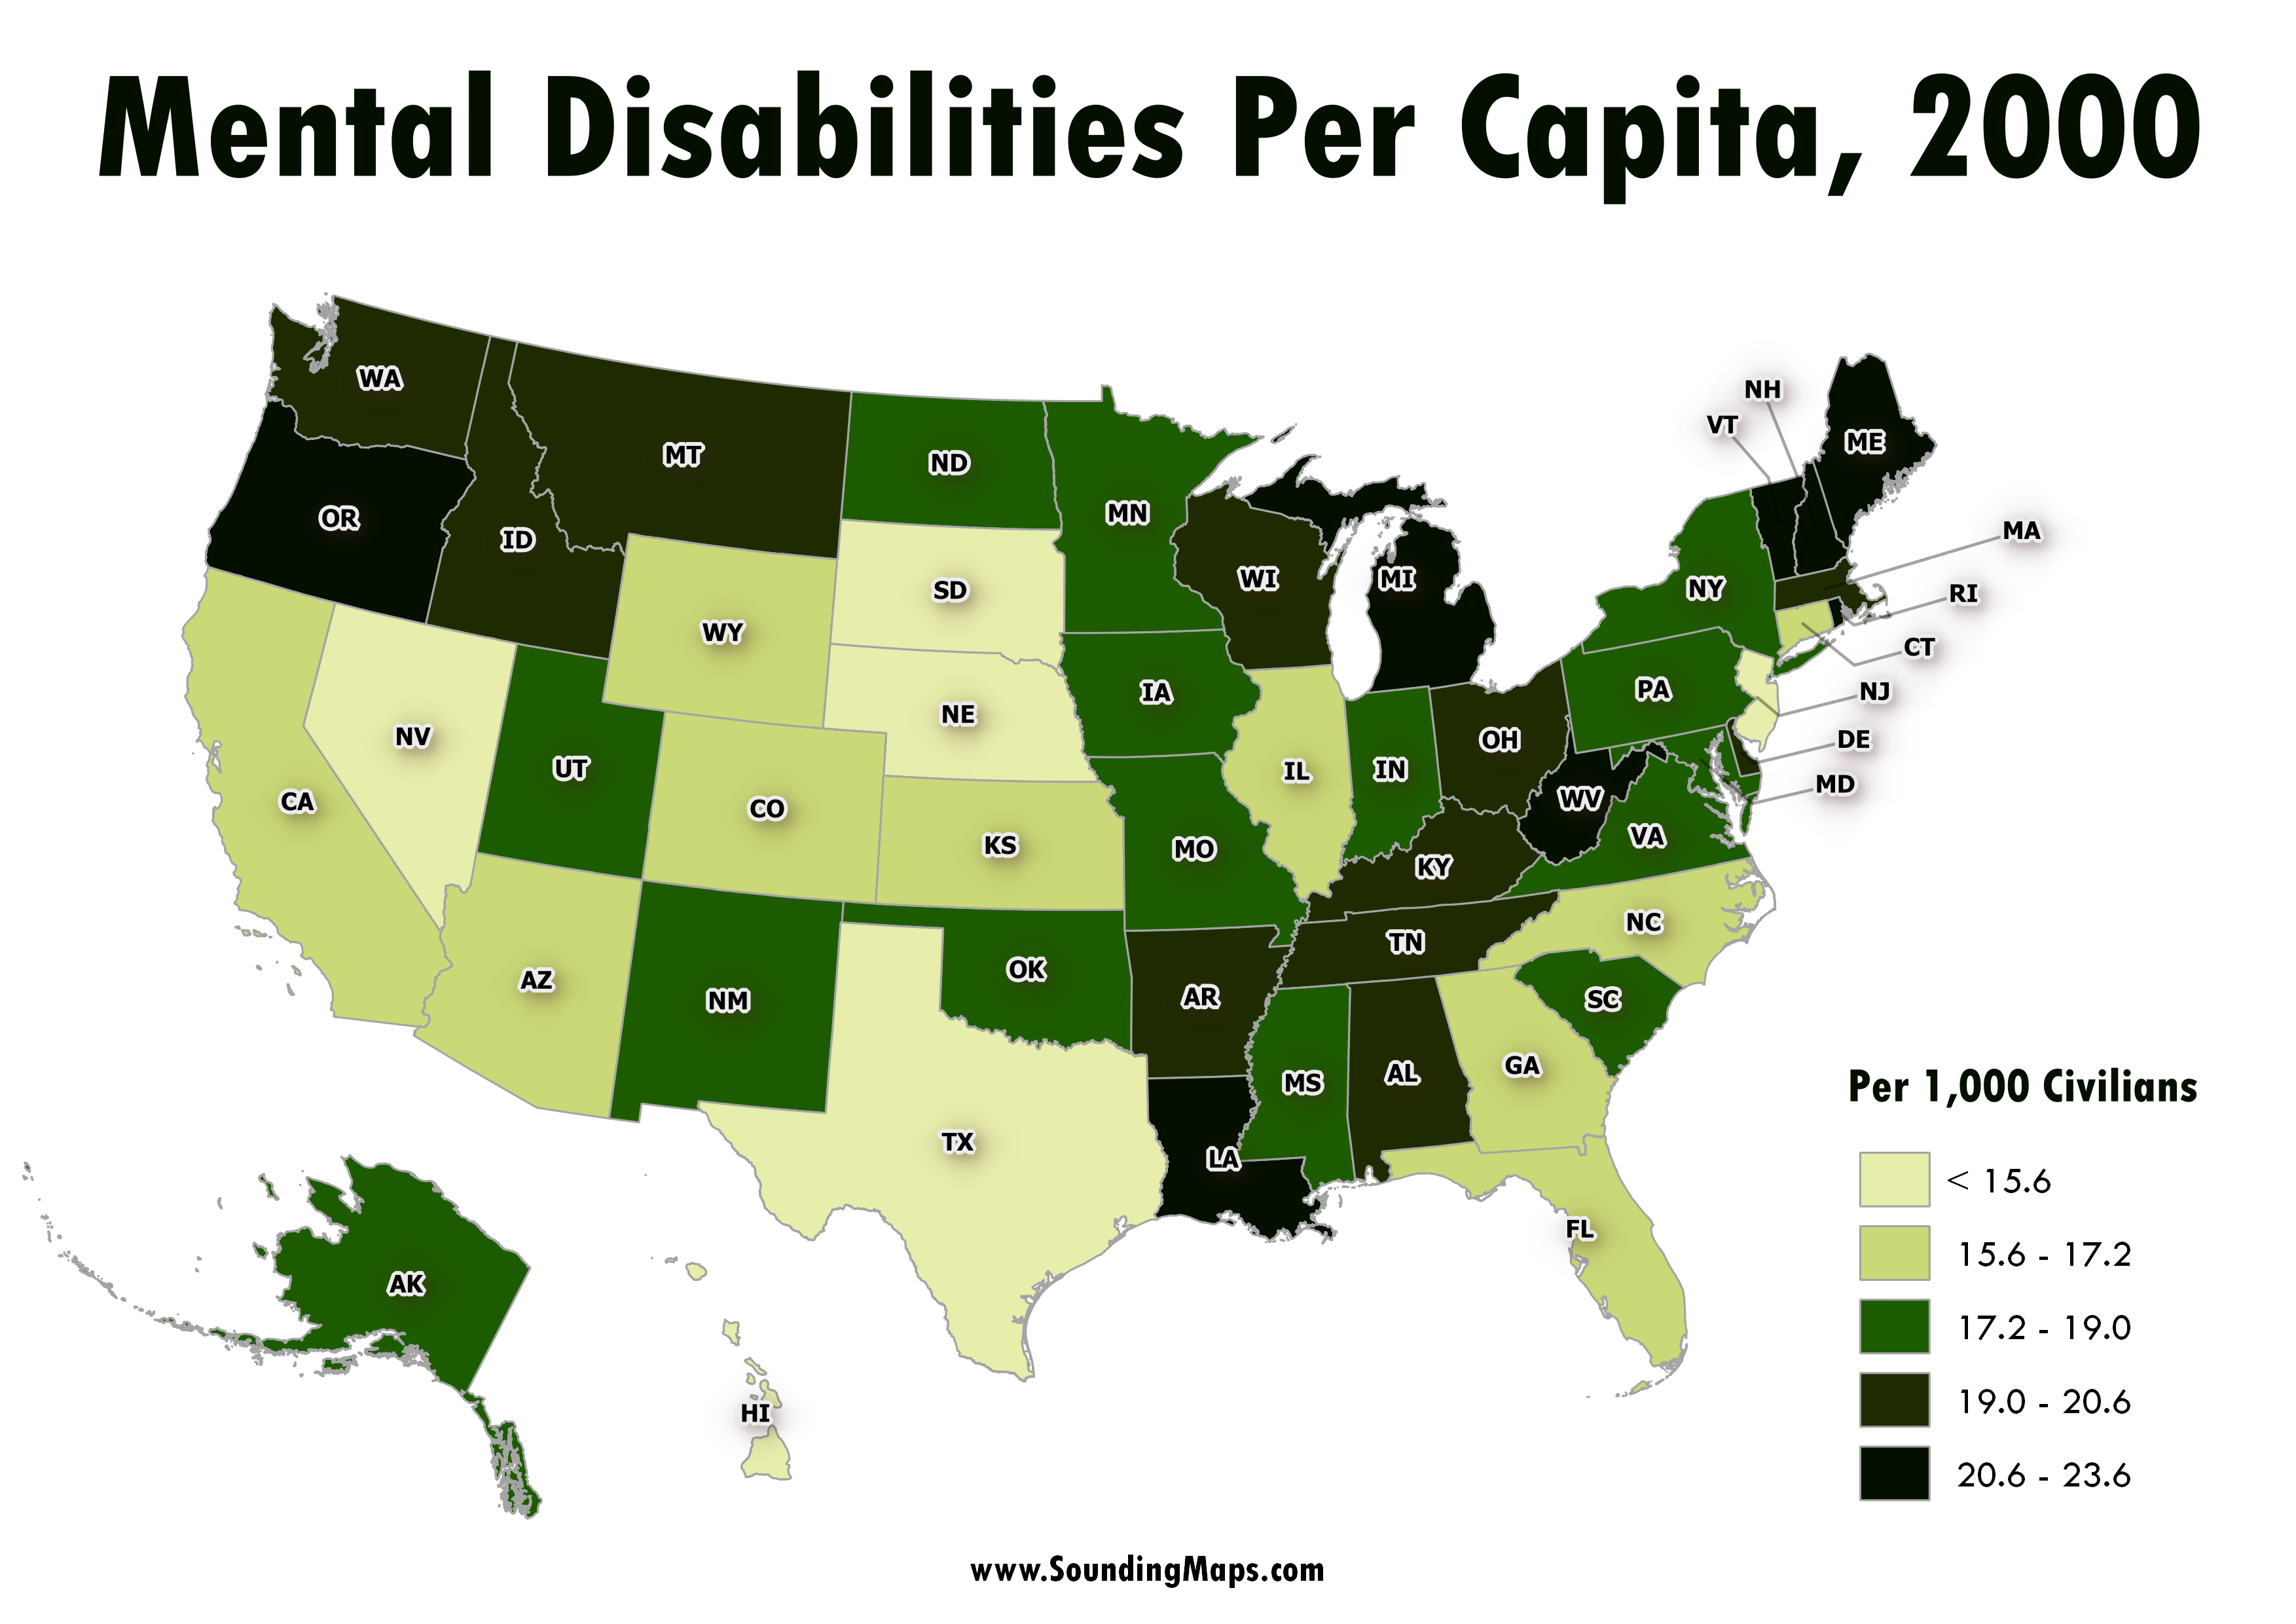
This map represents the mental disability status of the civilian non-institutionalized population of the United States regions in the year 2000. Census 2000 counted 49.7 million people with some type of long lasting condition or disability. They represented 19.3 percent of the 257.2 million people who were aged 5 and […]