MSC, the Geneva-based Mediterranean Shipping Company, controls about 7.5 million TEU of container capacity. That is more than one-fifth of the world’s fleet. It also has more capacity than Maersk and Hapag-Lloyd combined. Yet MSC is private and publishes no official revenue or profit figures. So any list of the biggest shipping companies depends on how you measure size.
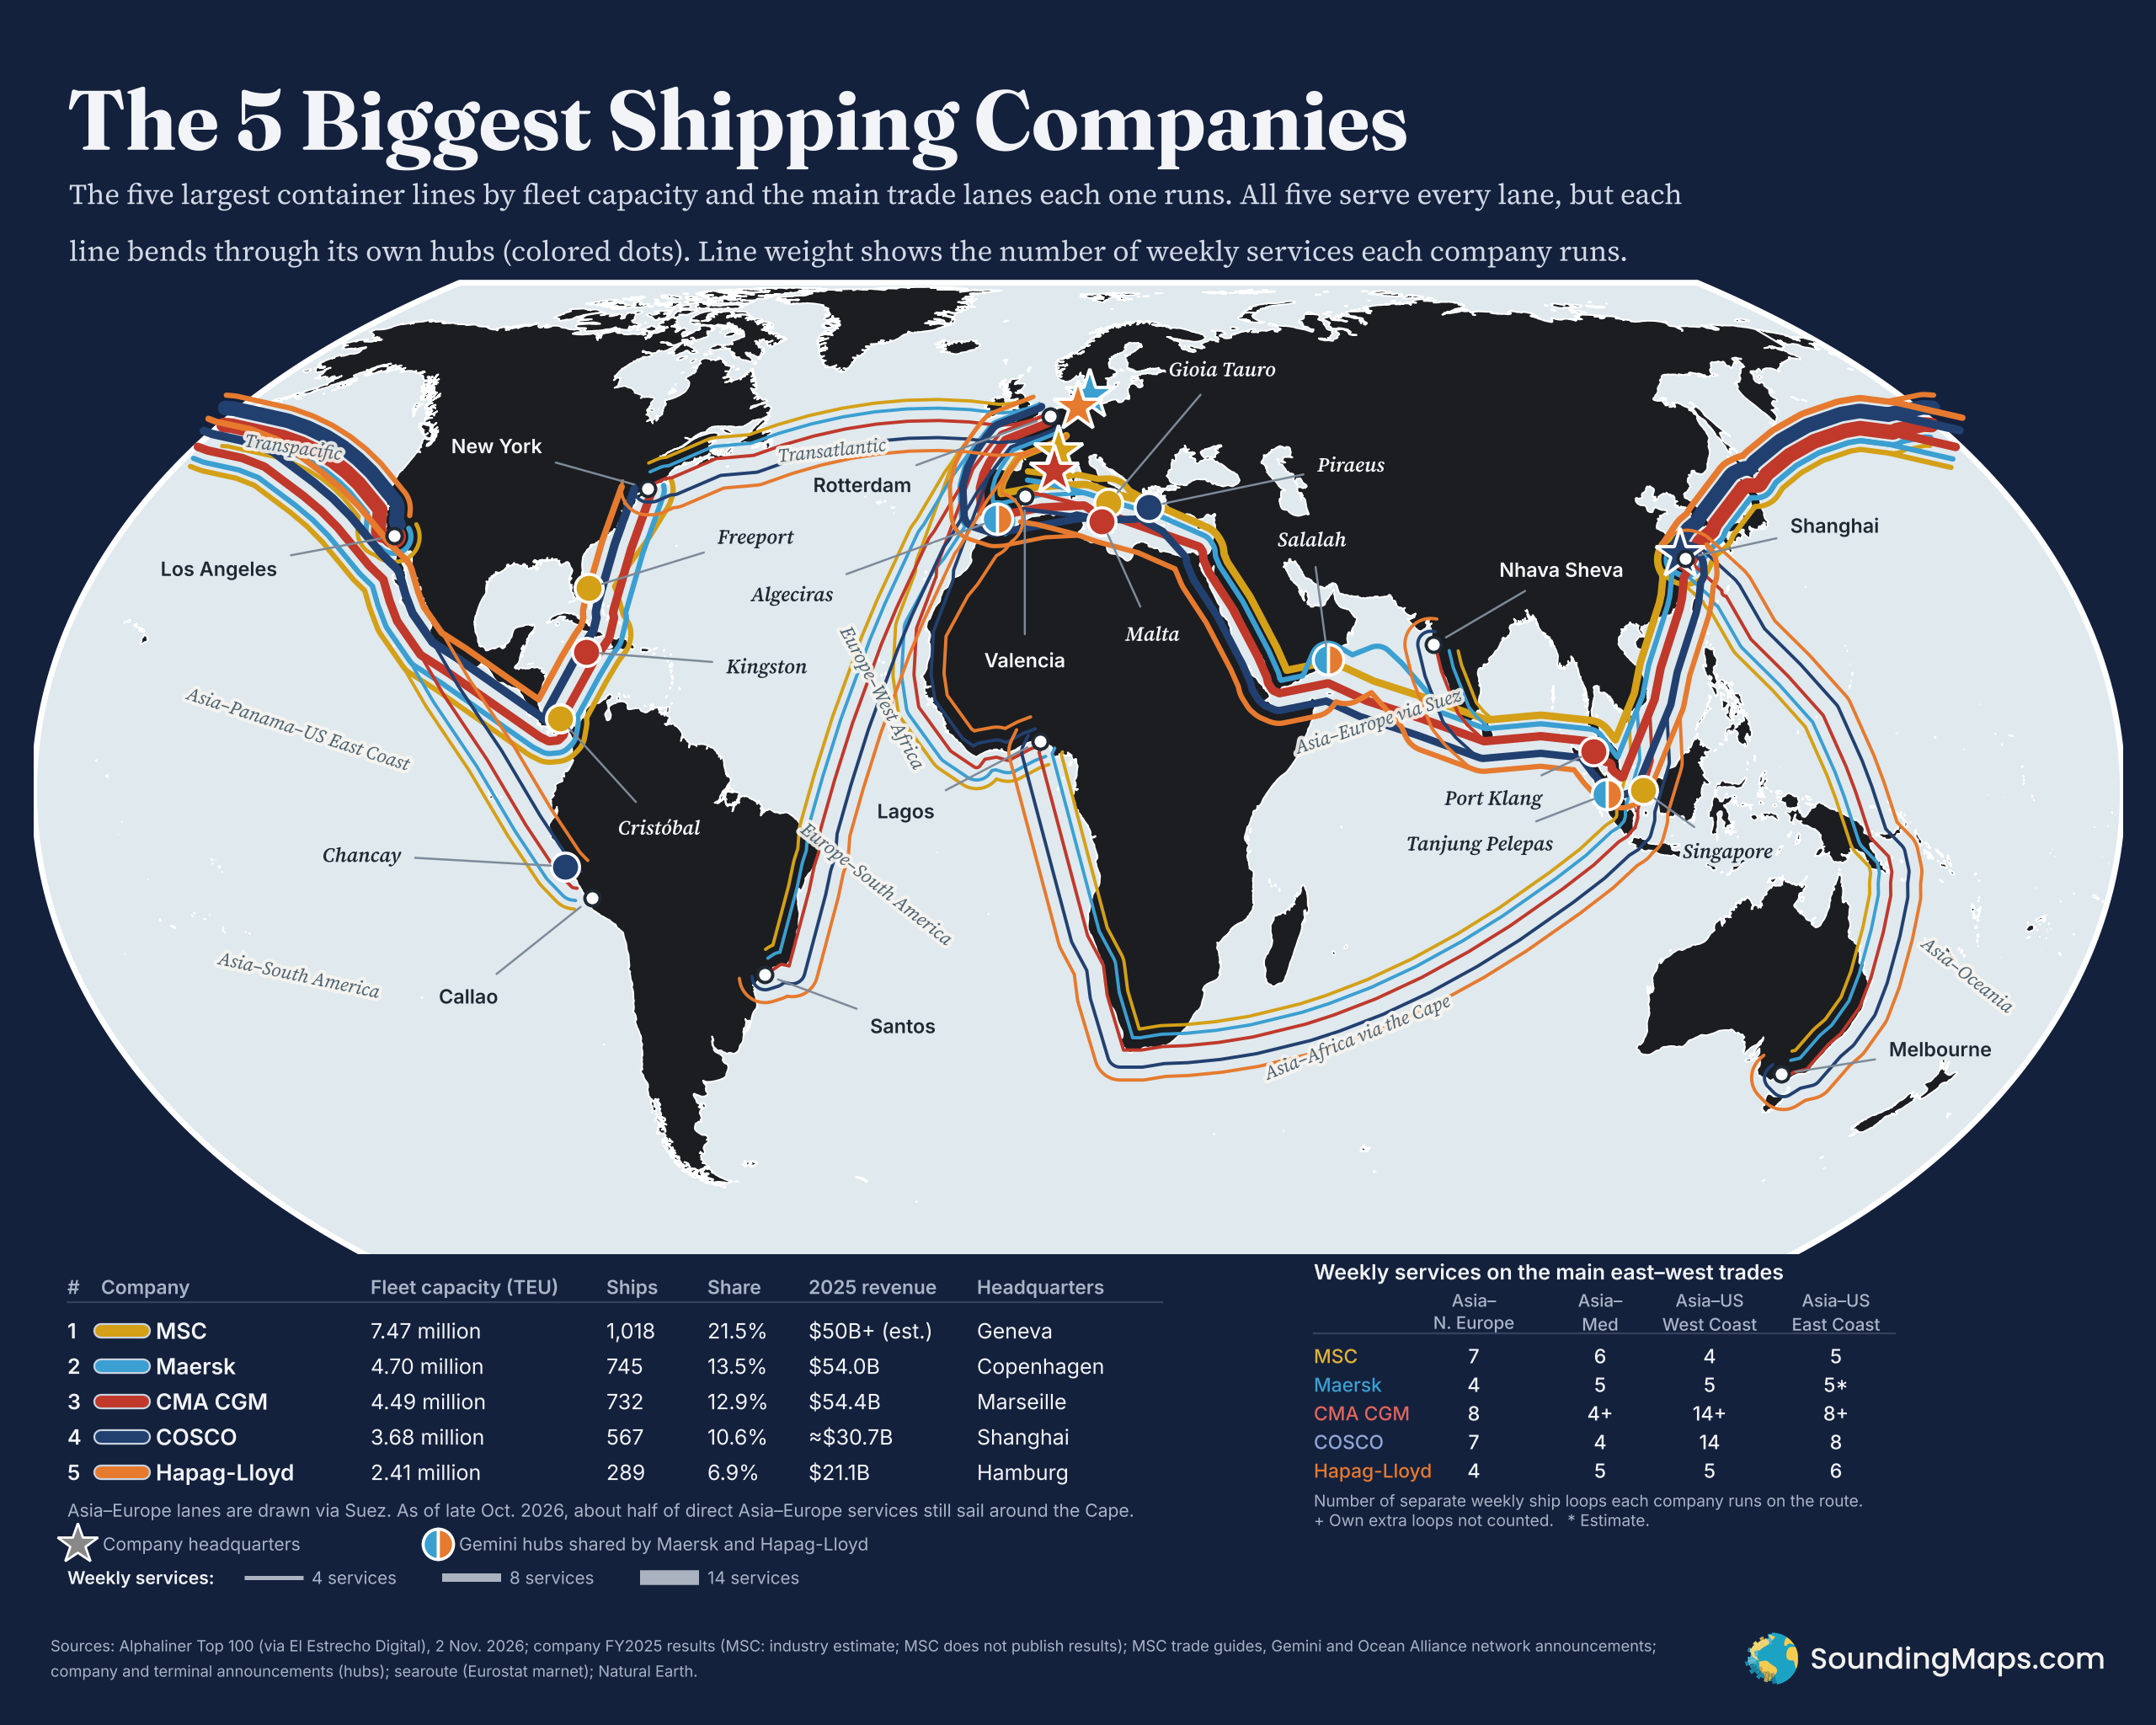
This map ranks the five largest container lines by fleet capacity, using Alphaliner’s count from November 2, 2026. It then traces the main ocean trade lanes each one runs.
The 5 Biggest Shipping Companies
The five largest container lines by fleet capacity and the main trade lanes each one runs. Click a company to see only its routes and hubs. Line weight shows the number of weekly services each company runs.
| Weekly services from Asia | ||||||||
|---|---|---|---|---|---|---|---|---|
| Company | Fleet (TEU) | Ships | Share | 2025 revenue | N. Europe | Med | US West | US East |
The last four columns are weekly services: the number of separate weekly ship loops each company runs from Asia on that route (Nov. 2026); shared alliance loops count for each partner. + CMA CGM also runs own loops not counted. * Estimate. Asia–Europe lanes are drawn via Suez; as of late Oct. 2026 about half of direct Asia–Europe services still sail around the Cape. Stars mark headquarters. MSC is private and does not publish results; its revenue is an industry estimate.
Container capacity is measured in TEU, or twenty-foot equivalent units. One TEU is roughly one standard 20-foot box. Alphaliner counts every ship a company operates, owned or chartered. Together the top five control about 65 percent of the world’s container capacity.
“Weekly services” below counts the separate scheduled loops a company runs on each trade from Asia. Each loop is a fixed rotation of ships that calls at the same ports once a week.
Top 5 Shipping Companies
1. MSC – $50B+ (est.) Revenue
- Fleet capacity: 7.47 million TEU
- Ships: 1,018
- Share of world fleet: 21.5%
- 2025 revenue: $50B+ (industry estimate; MSC does not publish results)
- Headquarters: Geneva, Switzerland
- Network: Standalone East–West network since February 2025
- Hubs shown: Gioia Tauro, Singapore, Freeport, Cristóbal
- Weekly services: Asia–North Europe 7, Asia–Mediterranean 6, Asia–US West Coast 4, Asia–US East Coast 5
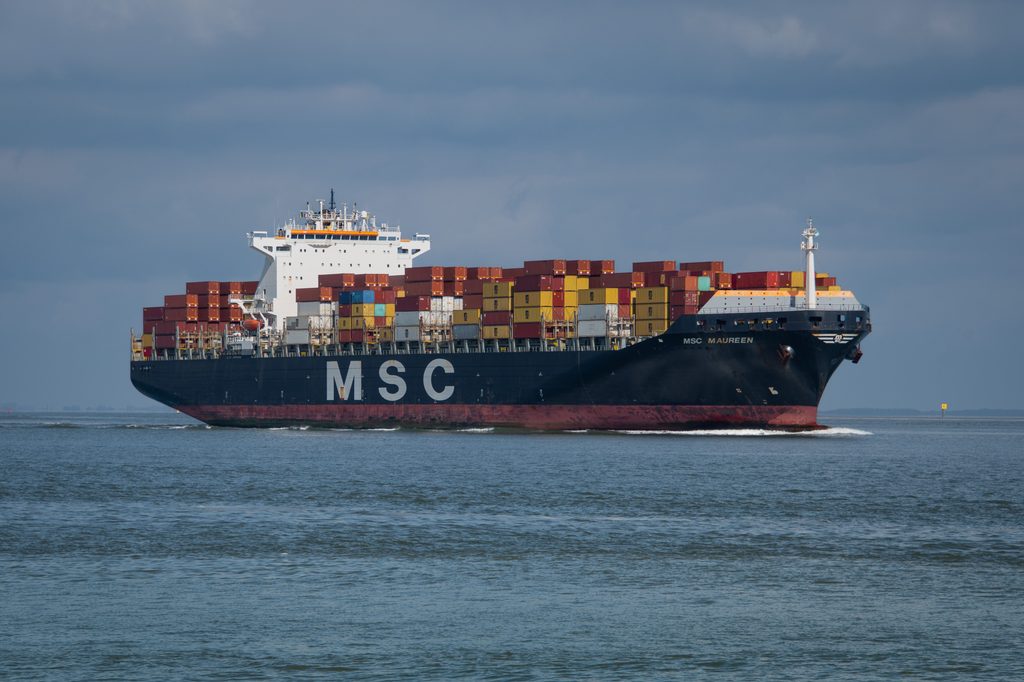
MSC is the largest container line by a wide margin. It has more capacity than Maersk and Hapag-Lloyd combined. The Aponte family owns it privately, so it releases no official revenue or profit figures.
2. Maersk – $54.0B Revenue
- Fleet capacity: 4.70 million TEU
- Ships: 745
- Share of world fleet: 13.5%
- 2025 revenue: $54.0B
- Headquarters: Copenhagen, Denmark
- Network: Gemini Cooperation (with Hapag-Lloyd)
- Hubs shown: Tanjung Pelepas, Salalah, Algeciras
- Weekly services: Asia–North Europe 4, Asia–Mediterranean 5, Asia–US West Coast 5, Asia–US East Coast 5 (estimate)
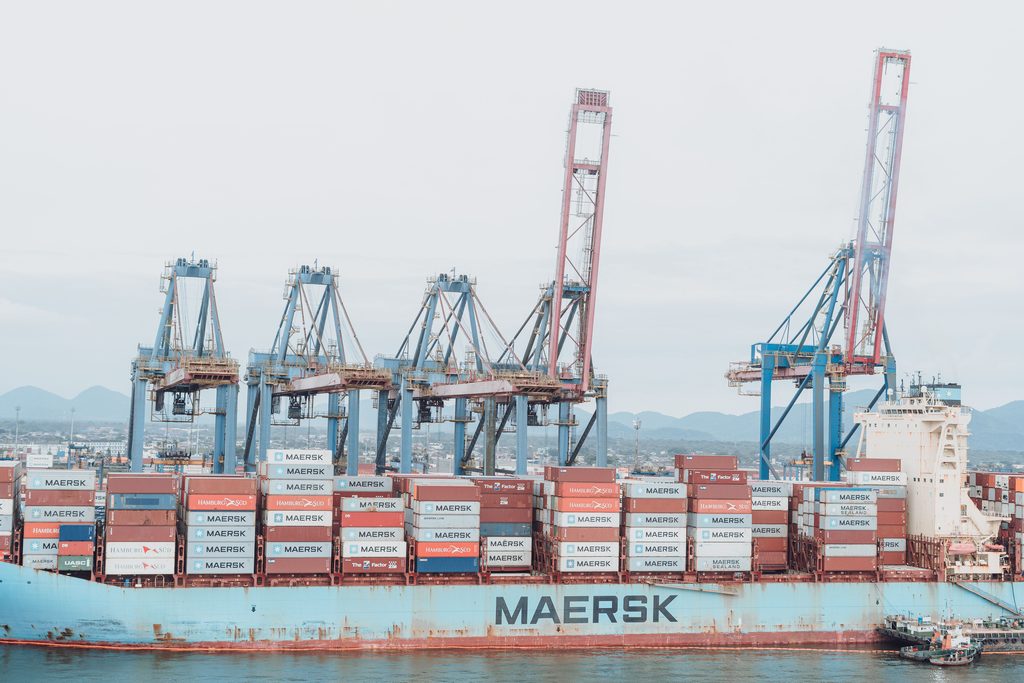
Maersk’s revenue includes large logistics and terminal businesses. Its Gemini network leans on a few hub ports, many run by its terminal arm, APM Terminals.
3. CMA CGM – $54.4B Revenue
- Fleet capacity: 4.49 million TEU
- Ships: 732
- Share of world fleet: 12.9%
- 2025 revenue: $54.4B (shipping alone: $34.3B)
- Headquarters: Marseille, France
- Network: Ocean Alliance (with COSCO, OOCL and Evergreen)
- Hubs shown: Malta, Kingston, Port Klang
- Weekly services: Asia–North Europe 8, Asia–Mediterranean 4+, Asia–US West Coast 14+, Asia–US East Coast 8+
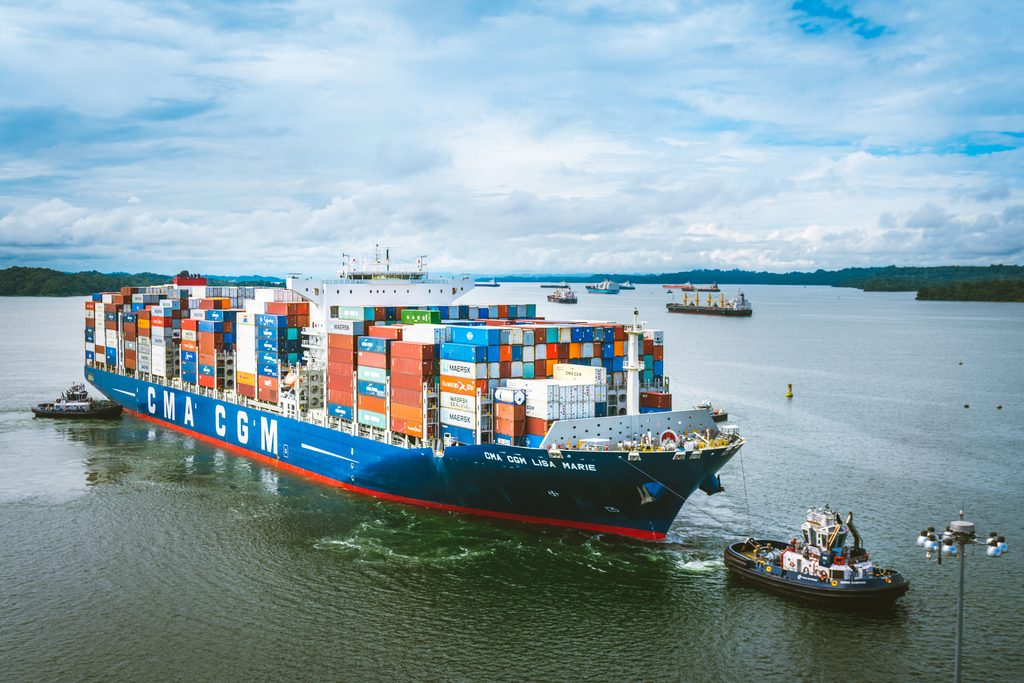
CMA CGM reported the highest revenue of the five in 2025, narrowly ahead of Maersk. The “+” marks routes where it also runs its own loops outside the alliance, which these counts leave out.
4. COSCO – ≈$30.7B Revenue
- Fleet capacity: 3.68 million TEU (including OOCL)
- Ships: 567
- Share of world fleet: 10.6%
- 2025 revenue: ≈$30.7B (CNY 219.5B, COSCO Shipping Holdings)
- Headquarters: Shanghai, China
- Network: Ocean Alliance (with CMA CGM, OOCL and Evergreen)
- Hubs shown: Piraeus, Chancay
- Weekly services: Asia–North Europe 7, Asia–Mediterranean 4, Asia–US West Coast 14, Asia–US East Coast 8
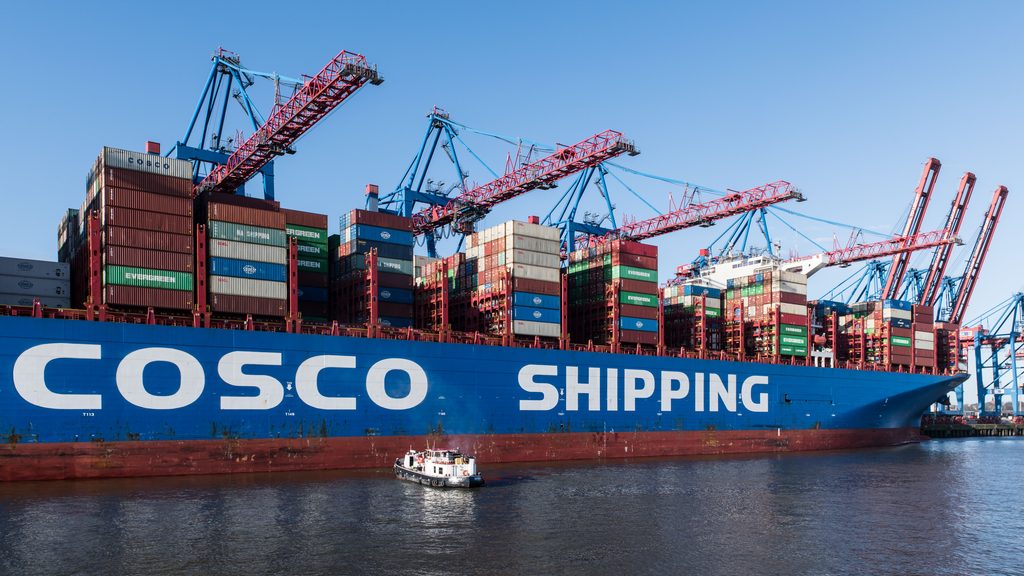
COSCO controls the port of Piraeus in Greece and the new deepwater port of Chancay in Peru. Its transpacific count matches CMA CGM’s because most of those loops are shared within the Ocean Alliance.
5. Hapag-Lloyd – $21.1B Revenue
- Fleet capacity: 2.41 million TEU
- Ships: 289
- Share of world fleet: 6.9%
- 2025 revenue: $21.1B
- Headquarters: Hamburg, Germany
- Network: Gemini Cooperation (with Maersk)
- Hubs shown: Tanjung Pelepas, Salalah, Algeciras
- Weekly services: Asia–North Europe 4, Asia–Mediterranean 5, Asia–US West Coast 5, Asia–US East Coast 6
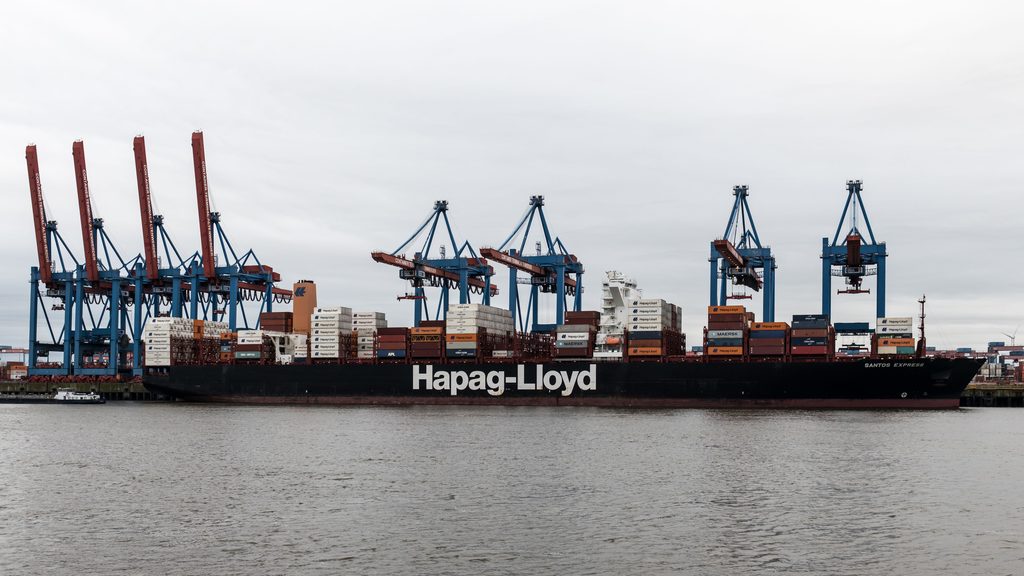
Hapag-Lloyd is the smallest of the five but shares most of its main-line network with Maersk. Ocean Network Express (ONE) ranks sixth, just behind it, with 2.22 million TEU.
Same Oceans, Different Partners
All five companies serve every lane on the map. Their lines split apart near the hub ports each one relies on. The real differences lie in partnerships and in where each company concentrates its ships.
Hub ports are where a carrier moves boxes from big ocean ships onto smaller feeder ships. MSC leans on Gioia Tauro in southern Italy, Singapore, and Freeport in the Bahamas. CMA CGM uses Malta, Port Klang in Malaysia and Kingston in Jamaica. COSCO controls the port of Piraeus in Greece and the new port of Chancay in Peru. Maersk and Hapag-Lloyd share hubs such as Tanjung Pelepas in Malaysia, Salalah in Oman and Algeciras in Spain.
Since February 2025, MSC has run its East–West network on its own. Maersk and Hapag-Lloyd share a network called the Gemini Cooperation. CMA CGM and COSCO belong to the Ocean Alliance, together with Evergreen and OOCL. Partners swap space on each other’s ships, so one loop can carry boxes for several lines.
Because alliance partners share ships, a shared loop appears in the service count of each partner. That is why CMA CGM and COSCO both list 14 services to the US West Coast.
The Red Sea Question
The map draws Asia–Europe lanes through the Suez Canal, the shortest route. In practice, routing is still mixed. Attacks on shipping pushed most carriers around Africa’s Cape of Good Hope from late 2023. That detour adds roughly 6,000 km on a Shanghai–Rotterdam run, according to the searoute routing used here.
Carriers began returning in 2026. MSC resumed Suez transits in August. Gemini moved several services back in September. An industry tally published October 27 found 24 of 46 direct Far East–Europe services using the Red Sea. The rest still sailed around the Cape.
Methodology and sources
Fleet figures come from the Alphaliner Top 100 for November 2, 2026, as republished by El Estrecho Digital. Group totals include subsidiaries, such as APL for CMA CGM and OOCL for COSCO. Revenue figures come from each company’s 2025 annual results. For MSC I used an unofficial industry estimate from trade analysis. Its source isn’t named, so treat it as approximate. I converted COSCO’s yuan figure at the exchange rate implied by its own US-dollar profit figure.
Service counts come from MSC’s 2026 trade service guides and the Gemini network documents from Maersk and Hapag-Lloyd. Ocean Alliance figures come from its DAY 10 product announcement. On the map, line weight on those four trades follows the same counts. A shared alliance loop counts once for each partner. CMA CGM also runs some loops outside the alliance that the table doesn’t count. Maersk’s figure for Asia–US East Coast services is an estimate. The Asia–Mediterranean counts for Maersk and Hapag-Lloyd include one Gemini service that starts on November 22, 2026.
Each lane on the map links one representative pair of ports. Every company line then bends through hub ports named in company documents and trade press. Maersk and Hapag-Lloyd share Gemini hubs, so their lines run together. The searoute Python package, built on the Eurostat maritime network, plotted the sea path for each pair. Real services call at many more ports along the way. The base map uses Natural Earth data in the Equal Earth projection.