Turnout in the 2026 Midterms, State by State
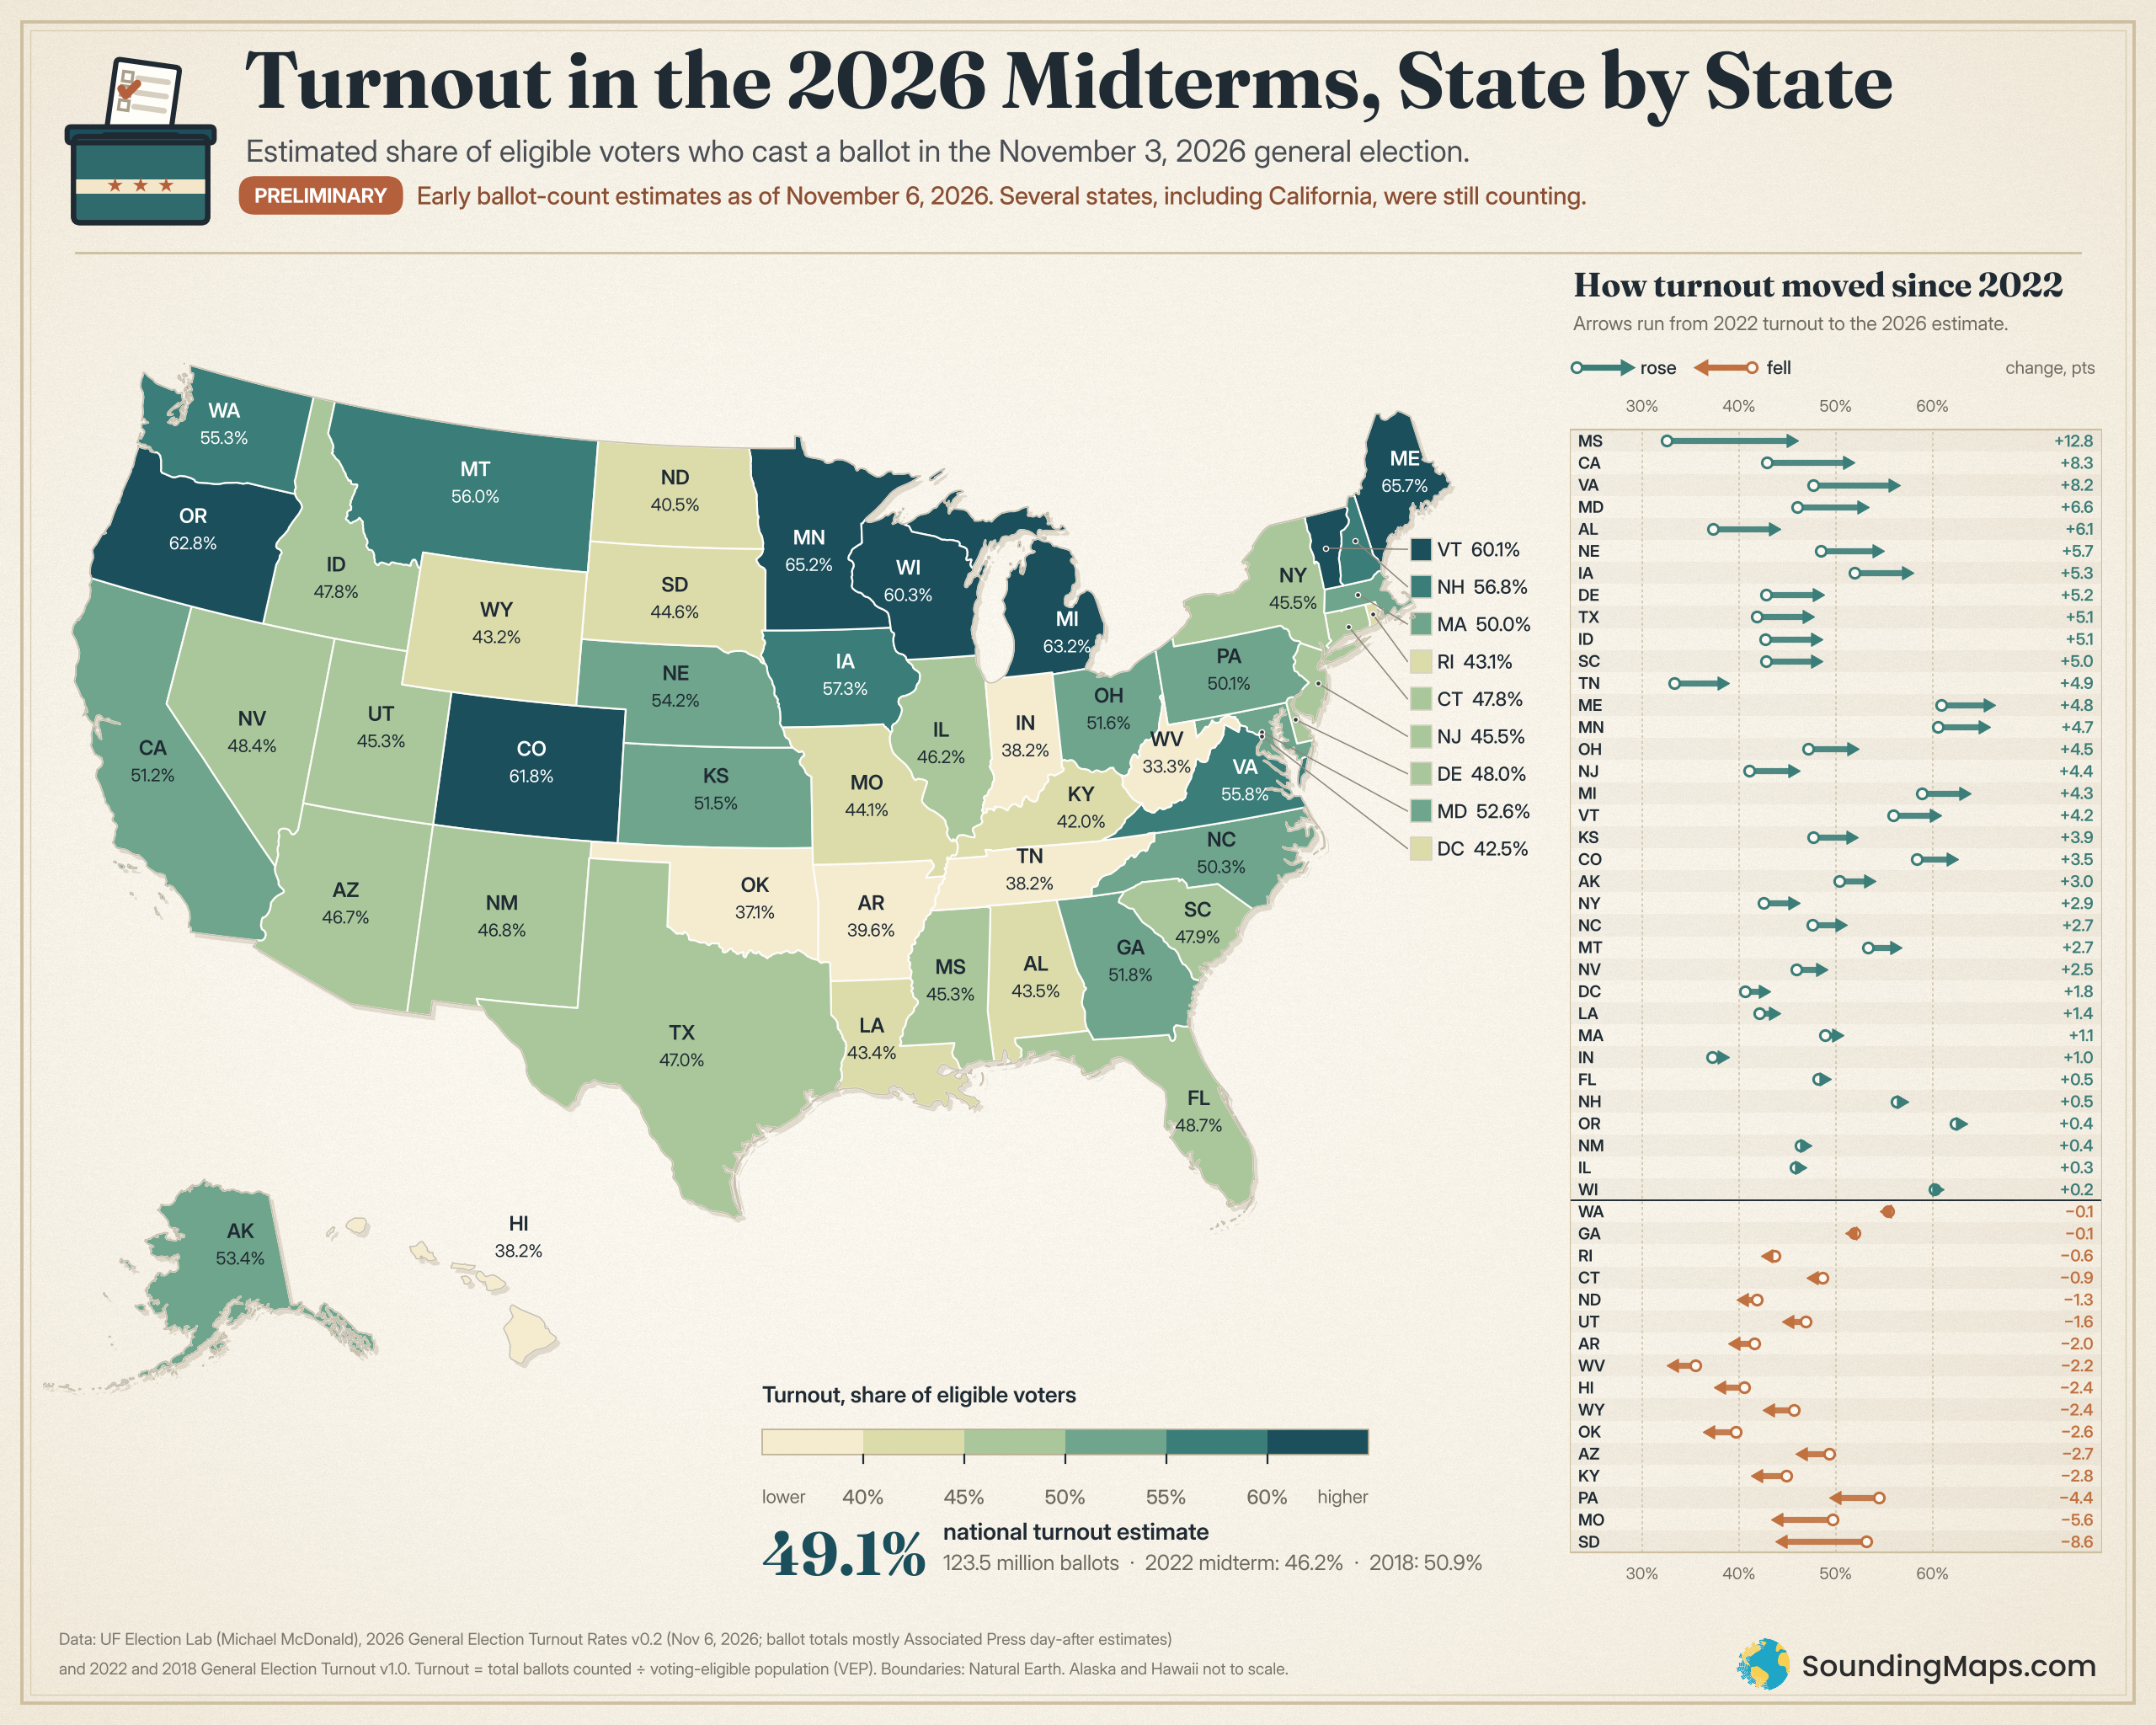
About 123.5 million Americans cast a ballot in the November 3, 2026 midterm election, according to early estimates. That works out to 49.1% of eligible voters. For comparison, the 2022 midterm drew 46.2%, and the 2018 midterm reached 50.9%.
These numbers are preliminary. They come from the UF Election Lab’s November 6 release. Most of its state totals are Associated Press estimates of the expected final vote. Several states, including California, were still counting ballots when the figures came out. So treat the map as a first look, not a final scorecard.
Where Turnout Was Highest
Maine led the country at an estimated 65.7%. Minnesota came next at 65.2%, followed by Michigan (63.2%), Oregon (62.8%) and Colorado (61.8%). Wisconsin and Vermont also cleared 60%.
Most of these states sit in the upper Midwest, the Northeast or the West. Several of them also have well-known election rules, such as same-day registration or ballots mailed to every voter. Still, the map alone can’t show which rules matter most, because high-turnout states differ in many other ways too.
Where Turnout Was Lowest
West Virginia had the lowest estimated turnout at 33.3%. Oklahoma followed at 37.1%. Next came Indiana, Tennessee and Hawaii, all at about 38%.
Arkansas, at 39.6%, rounds out the group of states below 40%. Together these six states form the palest shade on the map. Many of them also ranked near the bottom in 2022, so the pattern isn’t new.
How 2026 Compared With 2022
The bar chart on the right shows each state’s change from the 2022 midterm, in percentage points. Turnout rose in 35 states and fell in 16. The District of Columbia is counted as a state here.
Mississippi saw the biggest jump, from 32.5% in 2022 to an estimated 45.3% in 2026. California rose by 8.3 points, and Virginia climbed by 8.2. Eight more states, from Maryland and Alabama to Texas and South Carolina, gained at least 5 points.
On the other side, South Dakota fell the most, by 8.6 points. Missouri dropped 5.6 points and Pennsylvania 4.4. Kentucky, Arizona, Oklahoma, Wyoming, Hawaii and West Virginia each slipped by about 2 to 3 points.
Big swings often follow the ballot itself. A close Senate or governor’s race usually draws more voters than a ballot with no statewide contest at the top. Even so, this map doesn’t measure why turnout moved. The change column simply compares two counts.
| State | Ballots cast | 2026 turnout | Change from 2022 | |
|---|---|---|---|---|
| All 50 states and DC, highest turnout to lowest | ||||
| Maine | 759,000 | 65.7% | +4.8 pts | |
| Minnesota | 2,870,000 | 65.2% | +4.7 pts | |
| Michigan | 4,925,000 | 63.2% | +4.3 pts | |
| Oregon | 2,060,000 | 62.8% | +0.4 pts | |
| Colorado | 2,800,000 | 61.8% | +3.5 pts | |
| Wisconsin | 2,760,000 | 60.3% | +0.2 pts | |
| Vermont | 316,000 | 60.1% | +4.2 pts | |
| Iowa | 1,376,000 | 57.3% | +5.3 pts | |
| New Hampshire | 650,000 | 56.8% | +0.5 pts | |
| Montana | 508,000 | 56.0% | +2.7 pts | |
| Virginia | 3,670,000 | 55.8% | +8.2 pts | |
| Washington | 3,250,000 | 55.3% | −0.1 pts | |
| Nebraska | 792,000 | 54.2% | +5.7 pts | |
| Alaska | 290,000 | 53.4% | +3.0 pts | |
| Maryland | 2,383,000 | 52.6% | +6.6 pts | |
| Georgia | 4,200,000 | 51.8% | −0.1 pts | |
| Ohio | 4,700,000 | 51.6% | +4.5 pts | |
| Kansas | 1,120,000 | 51.5% | +3.9 pts | |
| California | 13,800,000 | 51.2% | +8.3 pts | |
| North Carolina | 4,245,000 | 50.3% | +2.7 pts | |
| Pennsylvania | 5,050,000 | 50.1% | −4.4 pts | |
| Massachusetts | 2,640,000 | 50.0% | +1.1 pts | |
| Florida | 8,325,000 | 48.7% | +0.5 pts | |
| Nevada | 1,150,000 | 48.4% | +2.5 pts | |
| Delaware | 383,000 | 48.0% | +5.2 pts | |
| South Carolina | 2,063,000 | 47.9% | +5.0 pts | |
| Idaho | 720,000 | 47.8% | +5.1 pts | |
| Connecticut | 1,320,000 | 47.8% | −0.9 pts | |
| Texas | 9,975,000 | 47.0% | +5.1 pts | |
| New Mexico | 740,000 | 46.8% | +0.4 pts | |
| Arizona | 2,605,000 | 46.7% | −2.7 pts | |
| Illinois | 4,300,000 | 46.2% | +0.3 pts | |
| New York | 6,565,000 | 45.5% | +2.9 pts | |
| New Jersey | 3,054,000 | 45.5% | +4.4 pts | |
| Mississippi | 998,000 | 45.3% | +12.8 pts | |
| Utah | 1,125,000 | 45.3% | −1.6 pts | |
| South Dakota | 310,000 | 44.5% | −8.6 pts | |
| Missouri | 2,120,000 | 44.1% | −5.6 pts | |
| Alabama | 1,721,000 | 43.5% | +6.1 pts | |
| Louisiana | 1,475,000 | 43.5% | +1.4 pts | |
| Wyoming | 195,000 | 43.2% | −2.4 pts | |
| Rhode Island | 370,000 | 43.1% | −0.6 pts | |
| District of Columbia | 223,000 | 42.5% | +1.8 pts | |
| Kentucky | 1,436,000 | 42.0% | −2.8 pts | |
| North Dakota | 243,000 | 40.5% | −1.3 pts | |
| Arkansas | 895,000 | 39.6% | −2.0 pts | |
| Tennessee | 2,092,000 | 38.2% | +4.9 pts | |
| Indiana | 1,980,000 | 38.2% | +1.0 pts | |
| Hawaii | 405,000 | 38.1% | −2.4 pts | |
| Oklahoma | 1,124,000 | 37.1% | −2.6 pts | |
| West Virginia | 464,000 | 33.3% | −2.2 pts | |
| United States | 123,540,000 | 49.1% | +2.9 pts | |
Source: UF Election Lab, 2026 General Election Turnout Rates (v0.2, November 6, 2026) and 2022 General Election Turnout (v1.0). Turnout is total ballots counted divided by the voting-eligible population. The 2026 ballot totals are early estimates and will change as states finish counting.
Why California's Number Will Likely Change
California counts mail ballots for weeks after Election Day. Its estimate of 13.8 million ballots is a projection of the final total, not a count of ballots already tallied. In fact, California's official 2022 total wasn't certified until December.
As a result, a few states could move up or down a shade once counting ends. Close calls near a class boundary are the most likely to shift. For example, Pennsylvania sits at 50.1%, just above the 50% line.
What "Eligible Voters" Means Here
Turnout on this map uses the voting-eligible population, or VEP. That starts with everyone 18 or older. Next, it removes non-citizens and people barred from voting because of a felony conviction, following each state's law. For the national figure, it also adds Americans living overseas who can vote.
This approach gives a fairer comparison between states than dividing by all adults. For instance, California and Texas have many adult residents who aren't citizens. Dividing by every adult would make their turnout look lower than it really is.
Methodology and Sources
The 2026 figures come from the UF Election Lab's "2026 General Election Turnout Rates" dataset (version 0.2, November 6, 2026). Michael McDonald maintains it. Ballot totals are mainly Associated Press day-after estimates. Also, the lab notes that California, Washington and others may take days to finalize.
The 2022 figures come from the same lab's final 2022 turnout dataset (version 1.0), which uses certified state results. Likewise, the 2018 national rate comes from the lab's 2018 dataset.
Turnout equals total ballots counted divided by the voting-eligible population. We recomputed each state's rate from the published ballot and VEP figures, and every value matched the lab's rates. The state totals also add up exactly to the national estimate of 123.54 million.
On the map, states fall into six turnout classes. State labels show rates to one decimal place, and each state's color follows that rounded figure. So Massachusetts, at 49.98%, appears as 50.0% in the 50–55% class. Alaska and Hawaii are moved and resized to fit. State boundaries come from Natural Earth.
This map reports turnout only. It says nothing about which party or candidate won any race.