
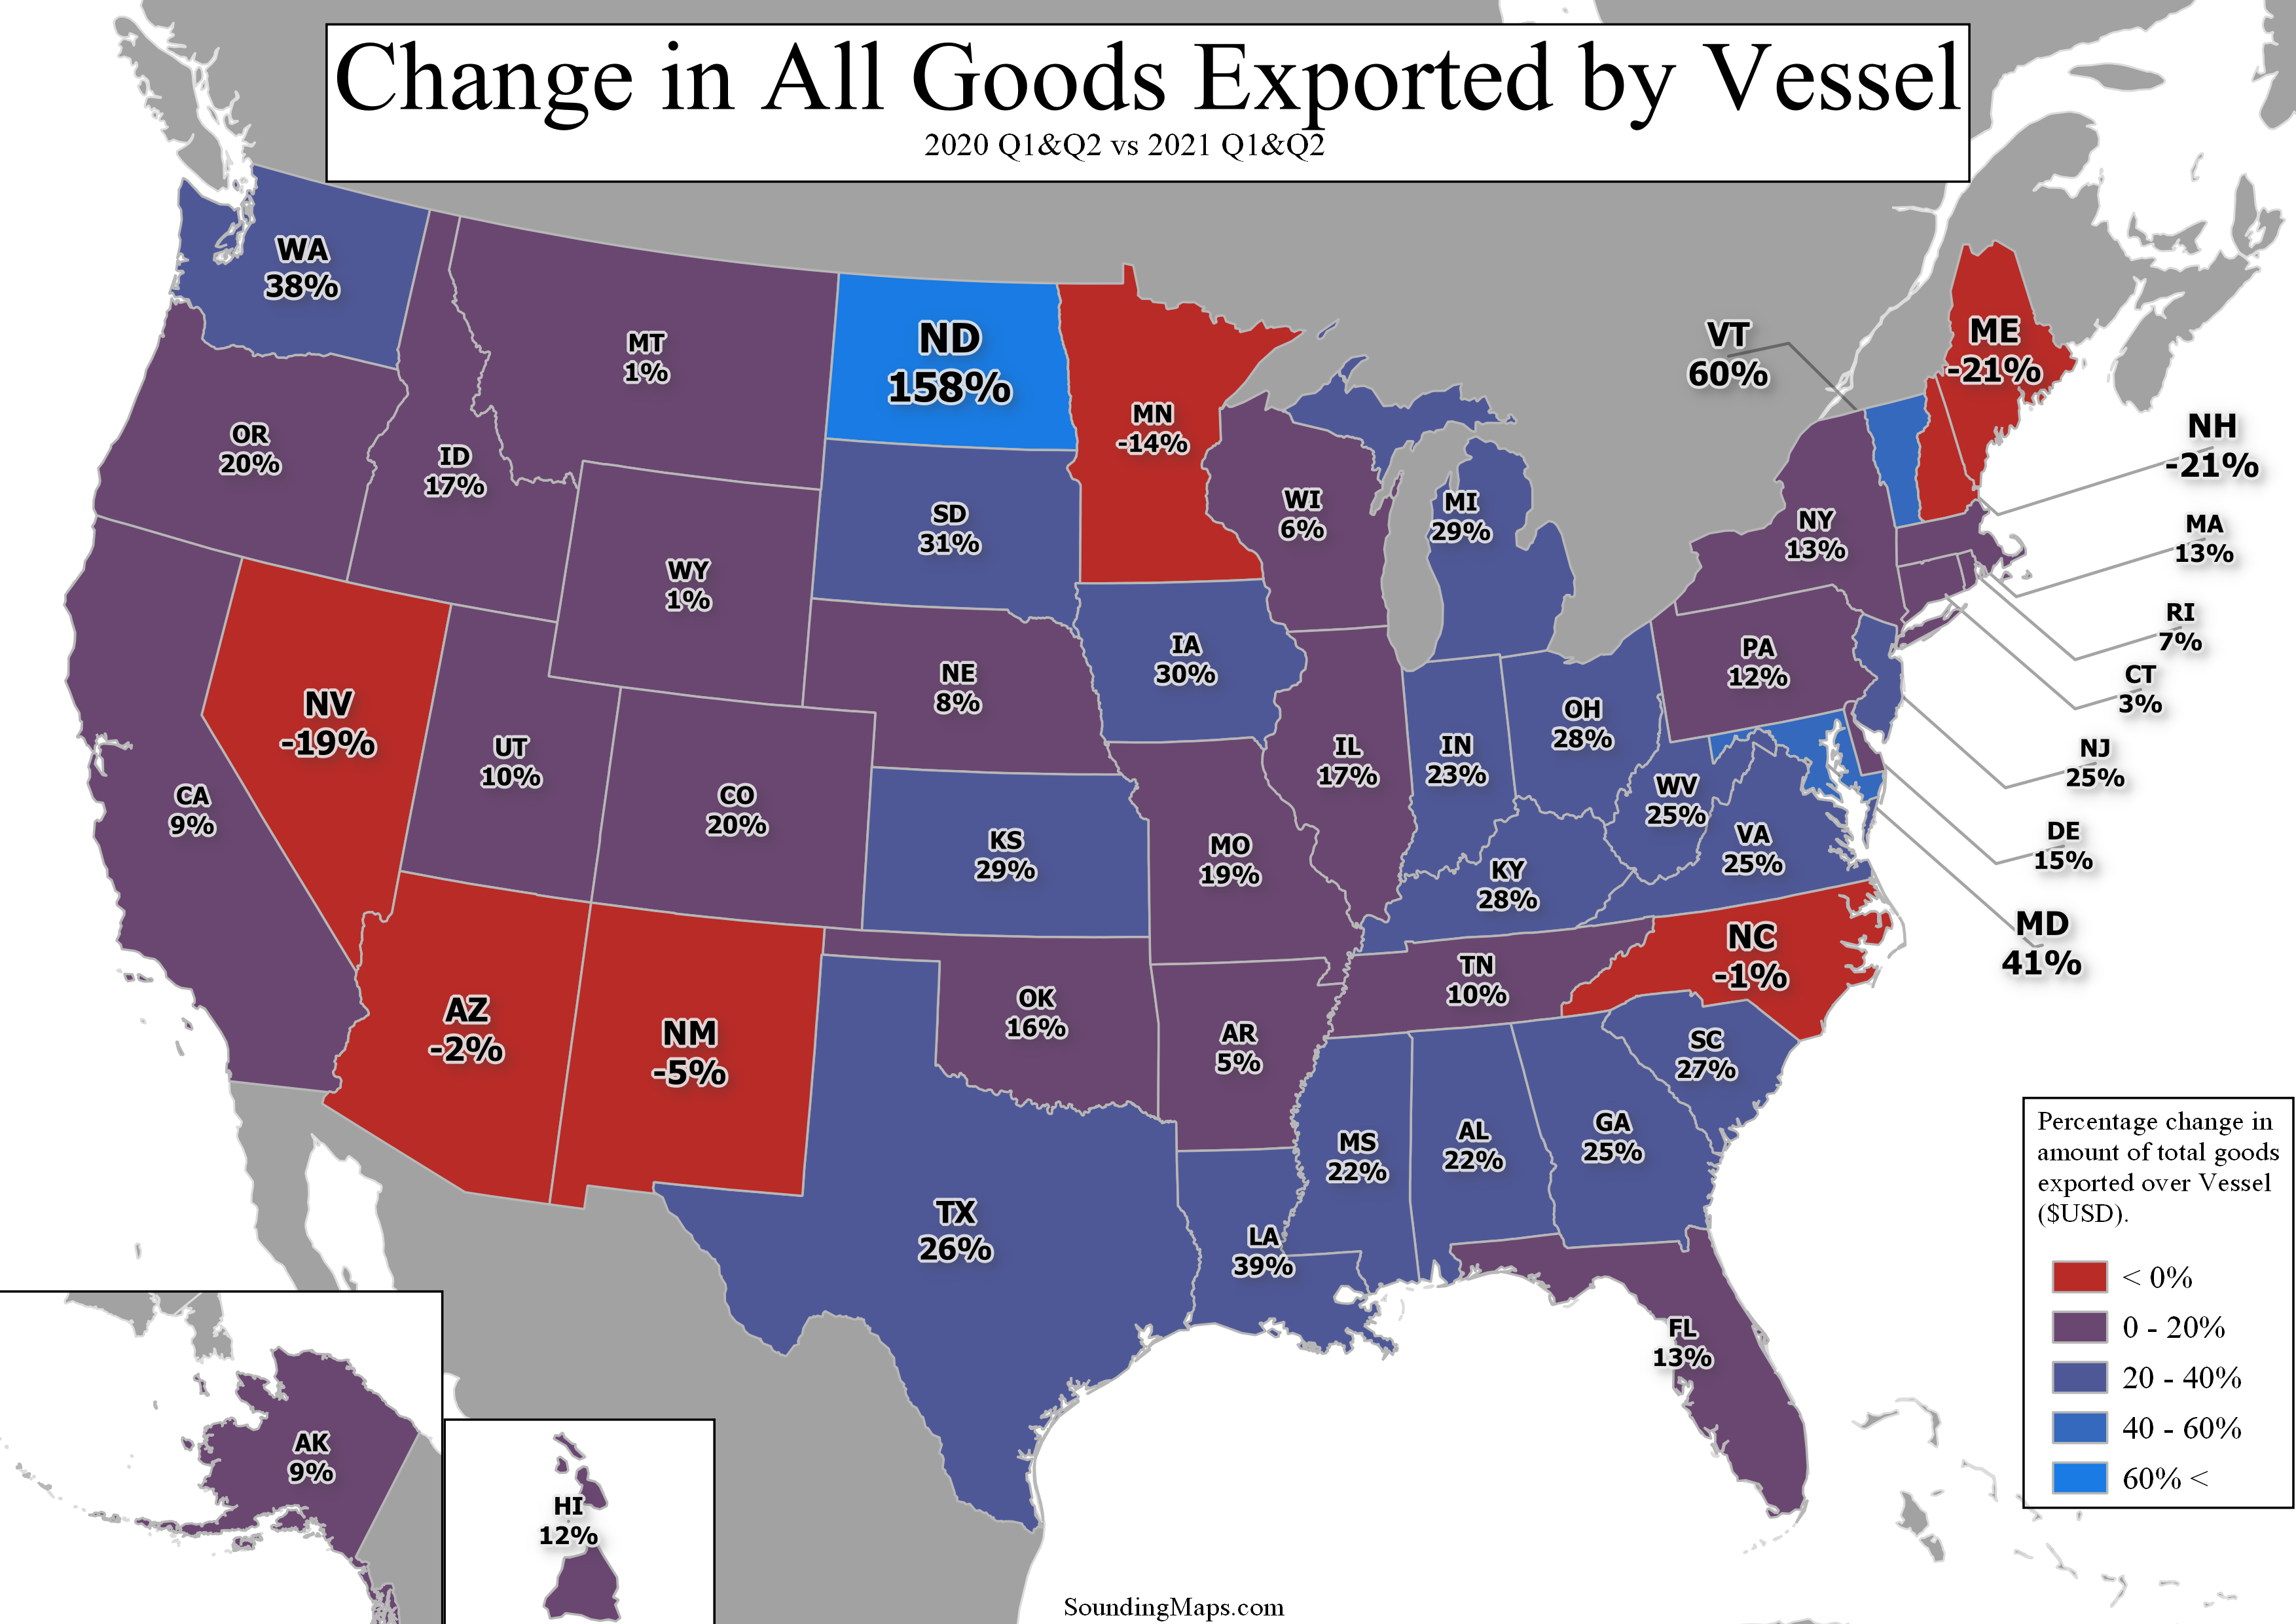
Now, this map shows key states that are adopting new modes of exporting goods. The mode being vessel. Vessel Exports Data was gathered from USA Trade Census and goods were classified using the HS code system. The vessel exports change was calculated taking the value of trade through vessel ports […]
Yearly Archives: 2021
2 posts
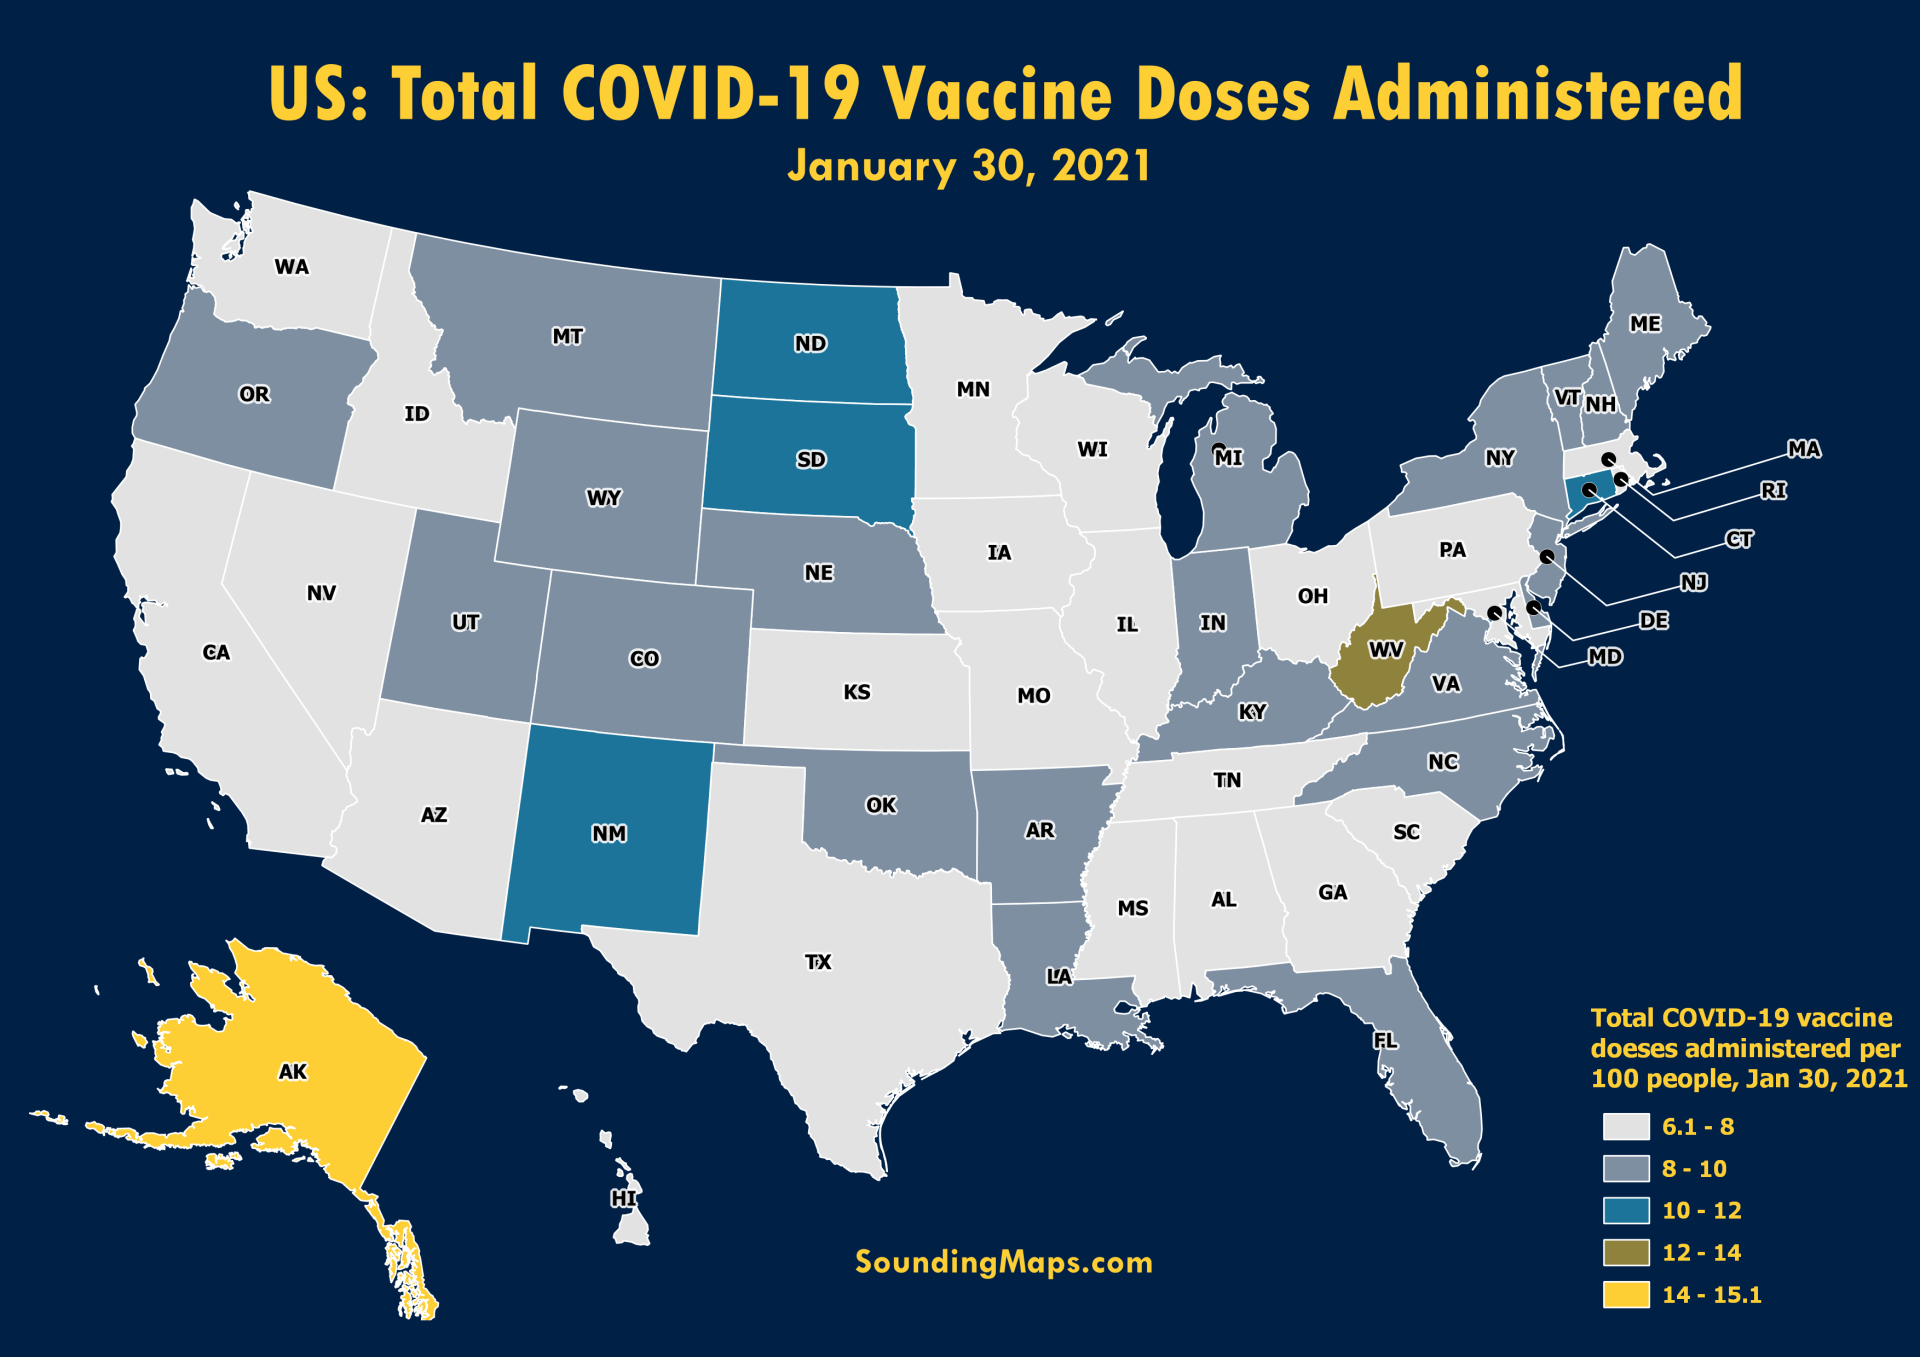
The United States COVID-19 vaccine dose map displayed above shows the states total number of COVID-19 vaccination doses administered per 100 people. The data used is counted as a single dose and may not equal the total number of people vaccinated. For example, one person may have received 3 doses […]