
Who Switched to the FBI’s NIBRS
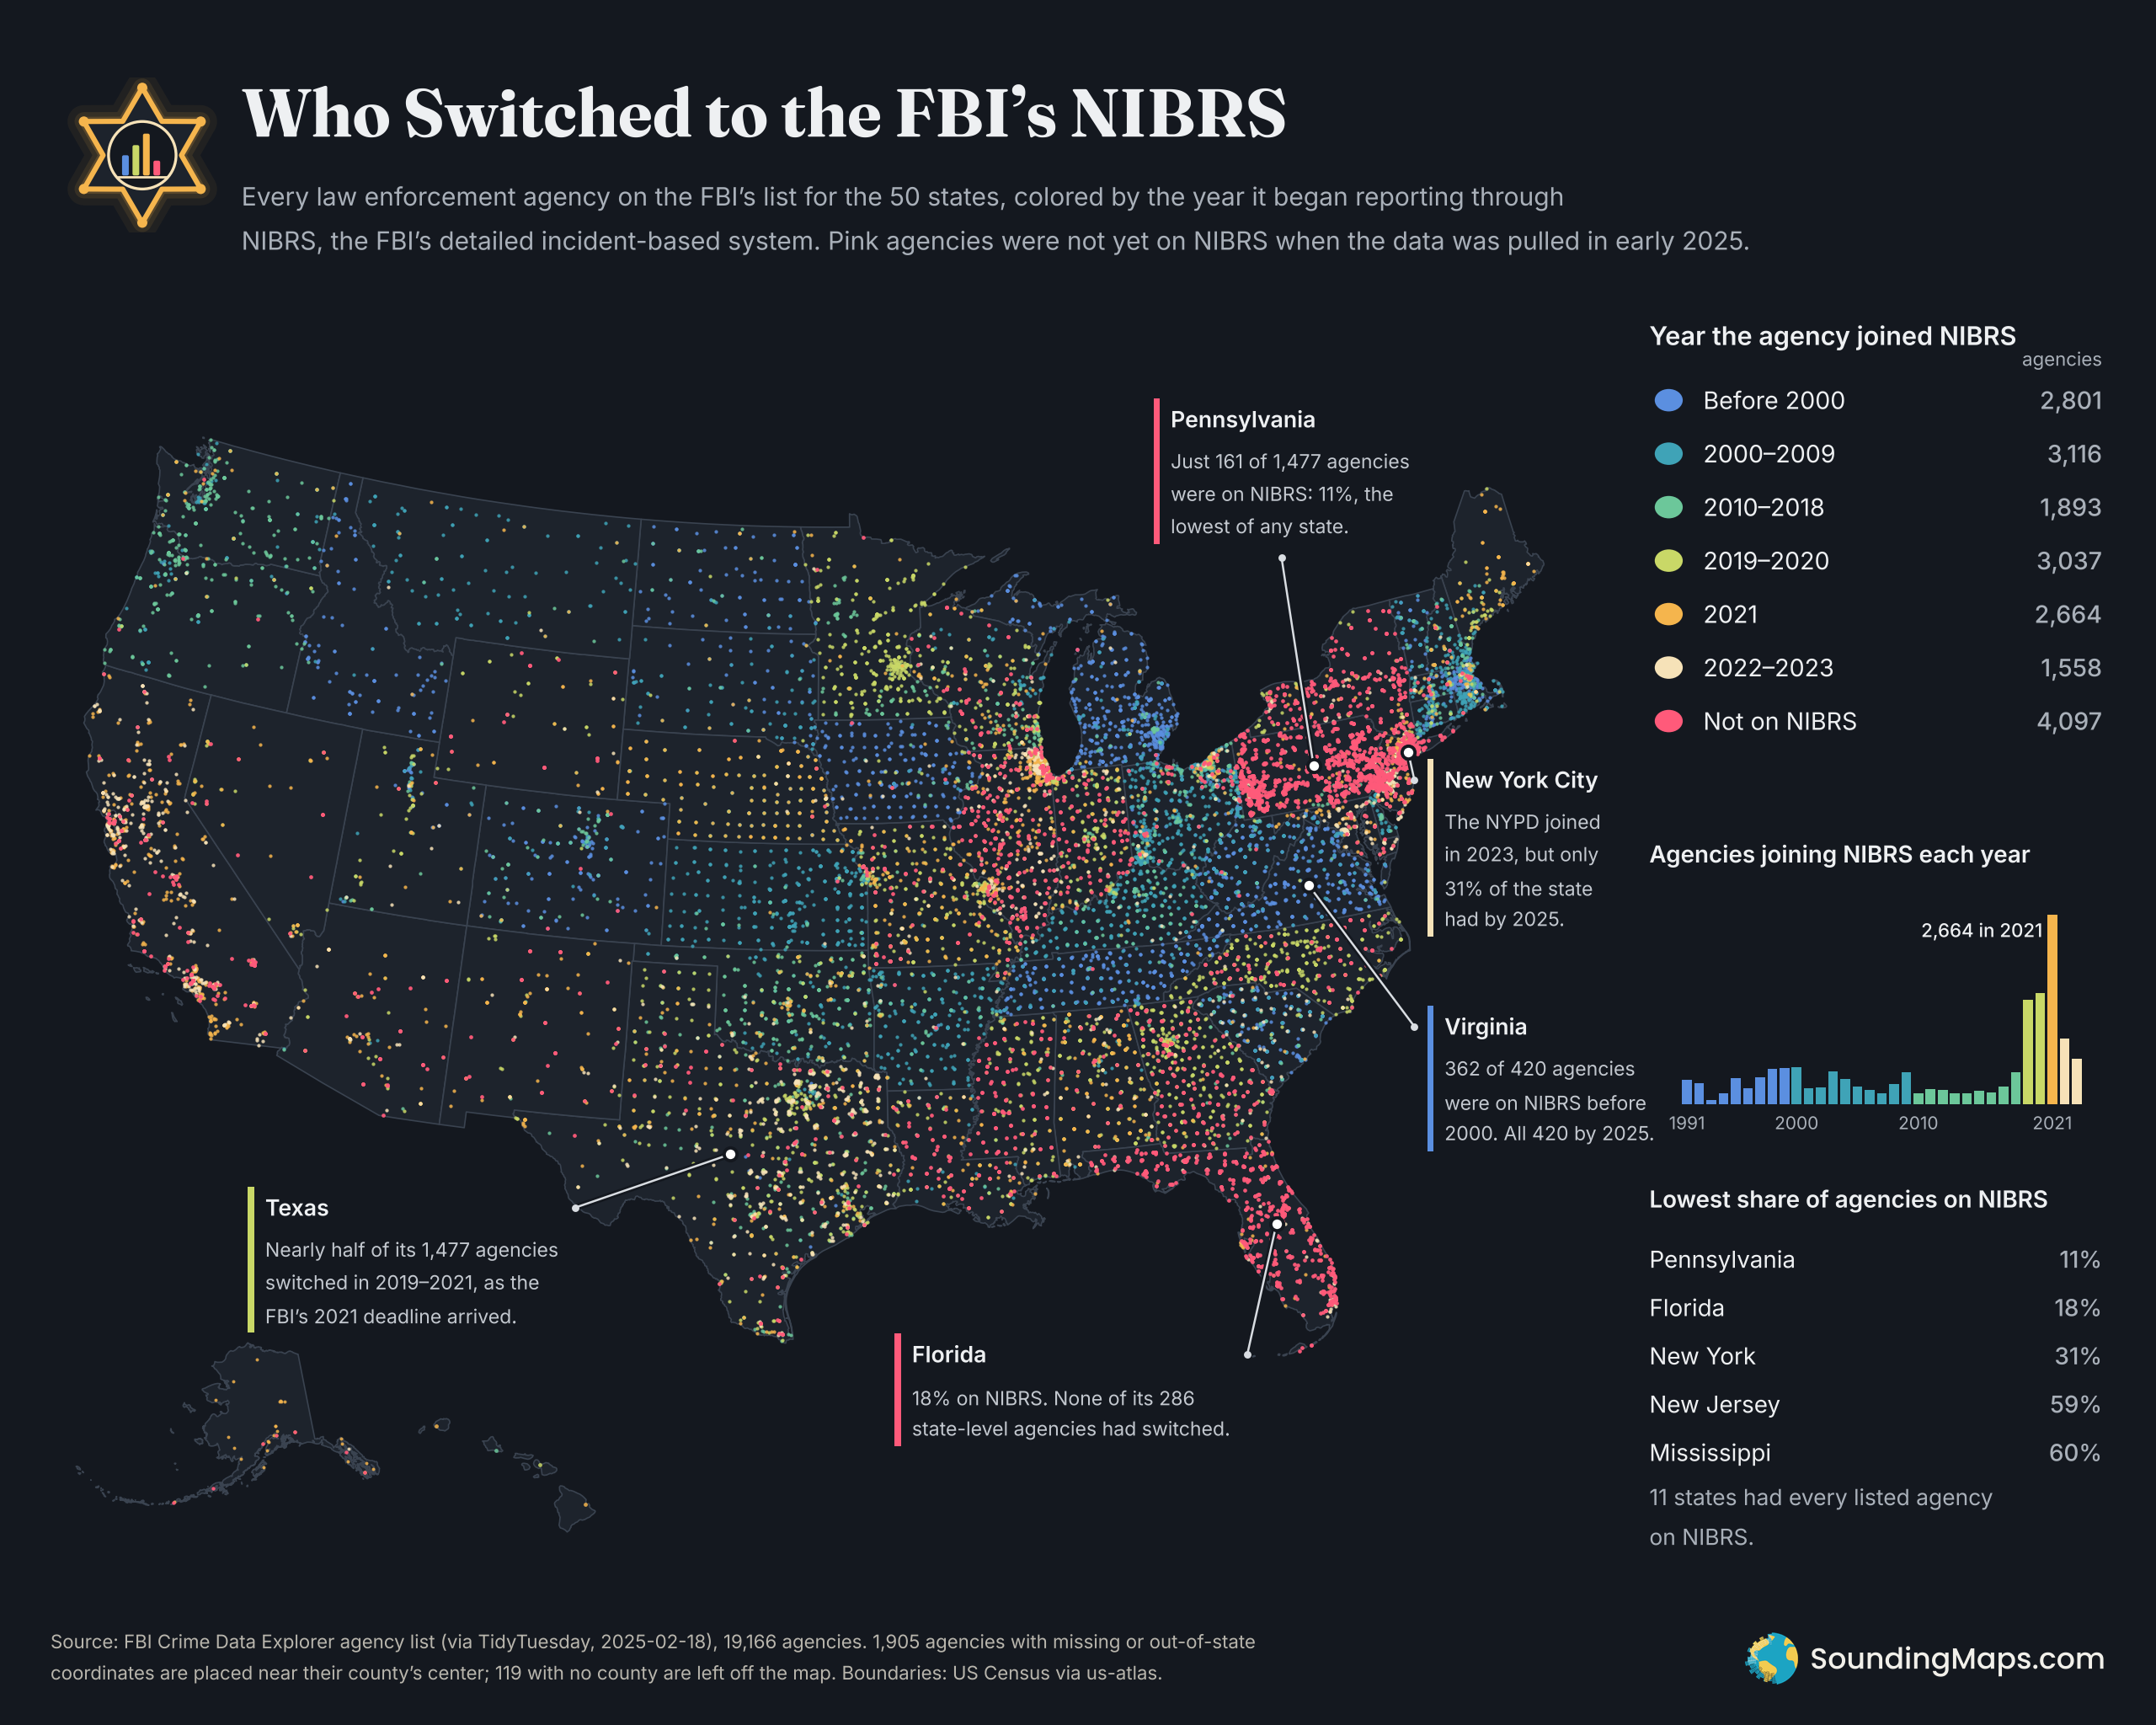
In early 2025, Pennsylvania had 1,477 law enforcement agencies in the FBI’s crime data system. Only 161 of them reported through NIBRS, the FBI’s modern crime reporting format. That’s 11%, the lowest share of any state.
This map shows every agency on the FBI’s list for the 50 states, 19,166 in all. Each dot is colored by the year the agency started reporting through NIBRS. Pink dots mark agencies that hadn’t switched yet when the data was pulled.
What NIBRS is
For most of the last century, police sent the FBI simple monthly tallies. That older format is the Summary Reporting System, or SRS. It counted a handful of offense types and kept little detail.
NIBRS, the National Incident-Based Reporting System, records each incident instead. It captures every offense in the incident, plus details on victims, offenders, property and arrests. The FBI made it available to agencies in the late 1980s.
Adoption crawled for decades. In 2016 the FBI announced it would retire SRS and accept only NIBRS starting in January 2021.
The 2021 rush
The bar chart on the map shows how agencies responded to the deadline. From 1991 through 2018, between 52 and 520 agencies joined each year. Then 1,473 agencies switched in 2019 and 1,564 in 2020.
The peak came in 2021, when 2,664 agencies began reporting through NIBRS. No other year comes close. Another 921 followed in 2022 and 637 in 2023.
Many agencies still missed the deadline. According to the Congressional Research Service, NIBRS covered 62.7% of agencies and 64.8% of the US population in 2021. That gap left holes in the 2021 national crime data. For 2022 and later years, the FBI took data in either format.
Where the holdouts are
Holdouts aren’t spread evenly. They pile up in a few states.
| State | Agencies listed | On NIBRS | Share on NIBRS |
|---|---|---|---|
| The five states with the lowest share | |||
| Pennsylvania | 1,477 | 161 | 11% |
| Florida | 758 | 133 | 18% |
| New York | 590 | 185 | 31% |
| New Jersey | 578 | 342 | 59% |
| Mississippi | 276 | 166 | 60% |
Source: FBI Crime Data Explorer agency list via TidyTuesday (Feb. 18, 2025).
Pennsylvania’s gap comes mostly from its municipal departments. Only 9% of its 939 city police agencies were on NIBRS. Florida’s list includes 219 state agencies, and none of them were on NIBRS.
New York shows a different pattern. The New York City Police Department joined in 2023, but most of the state’s smaller agencies had not.
At the other end, 11 states had every listed agency on NIBRS. They are Connecticut, Delaware, Hawaii, Idaho, Maine, Montana, North Dakota, Oklahoma, South Dakota, Vermont and Virginia.
Early adopters
The blue dots show agencies that switched before 2000. Idaho, Virginia, Michigan, Tennessee and Iowa stand out. In each of those states, at least three in four agencies had joined by 1999.
State lines show up in the colors, too. Kansas and Kentucky moved mostly in the 2000s, so they glow teal. Texas came late: about half its agencies switched between 2019 and 2021. That pattern suggests state-level programs set much of the timing.
What this means for crime data
When fewer agencies report, the FBI has to estimate more of the national picture. That matters most in big states with many holdouts. A national crime estimate leans harder on modeling when Pennsylvania or Florida is mostly missing.
The map doesn’t show crime rates. It shows which agencies send the detailed data that those rates are built on.
NIBRS Adoption, State by State
How many of each state’s law enforcement agencies had switched to the FBI’s NIBRS by early 2025, and the typical year they made the switch.
| State | Agencies | On NIBRS | Share on NIBRS | Typical year joined |
|---|---|---|---|---|
| All 50 states, lowest share to highest | ||||
| Pennsylvania | 1,477 | 161 | 11% | 2021 |
| Florida | 758 | 133 | 18% | 2021 |
| New York | 590 | 185 | 31% | 2021 |
| New Jersey | 578 | 342 | 59% | 2021 |
| Mississippi | 276 | 166 | 60% | 2020 |
| Illinois | 923 | 634 | 69% | 2021 |
| Louisiana | 235 | 165 | 70% | 2020 |
| Indiana | 357 | 260 | 73% | 2020 |
| California | 859 | 633 | 74% | 2021 |
| Wyoming | 70 | 52 | 74% | 2021 |
| Georgia | 663 | 498 | 75% | 2019 |
| Arizona | 126 | 100 | 79% | 2021 |
| New Mexico | 130 | 104 | 80% | 2021 |
| Alaska | 39 | 32 | 82% | 2021 |
| North Carolina | 535 | 442 | 83% | 2019 |
| Nevada | 72 | 61 | 85% | 2021 |
| Maryland | 157 | 135 | 86% | 2022 |
| Wisconsin | 458 | 394 | 86% | 2019 |
| Missouri | 599 | 536 | 89% | 2020 |
| Alabama | 446 | 415 | 93% | 2020 |
| Texas | 1,477 | 1,388 | 94% | 2020 |
| Ohio | 855 | 808 | 95% | 2006 |
| Massachusetts | 420 | 398 | 95% | 2001 |
| New Hampshire | 221 | 216 | 98% | 2003 |
| Rhode Island | 49 | 48 | 98% | 2004 |
| Colorado | 249 | 245 | 98% | 1997 |
| Nebraska | 287 | 283 | 99% | 2021 |
| Utah | 146 | 144 | 99% | 2016 |
| Oregon | 237 | 234 | 99% | 2014 |
| Iowa | 289 | 286 | 99% | 1992 |
| Arkansas | 316 | 313 | 99% | 2004 |
| West Virginia | 430 | 426 | 99% | 1999 |
| Kansas | 408 | 406 | >99% | 2000 |
| Minnesota | 411 | 409 | >99% | 2020 |
| Washington | 270 | 269 | >99% | 2011 |
| Michigan | 636 | 634 | >99% | 1996 |
| Tennessee | 412 | 411 | >99% | 1998 |
| Kentucky | 437 | 436 | >99% | 2009 |
| South Carolina | 514 | 513 | >99% | 1991 |
| Connecticut | 108 | 108 | 100% | 2002 |
| Delaware | 63 | 63 | 100% | 2001 |
| Hawaii | 4 | 4 | 100% | 2020 |
| Idaho | 112 | 112 | 100% | 1992 |
| Maine | 131 | 131 | 100% | 2020 |
| Montana | 115 | 115 | 100% | 2005 |
| North Dakota | 111 | 111 | 100% | 1991 |
| Oklahoma | 462 | 462 | 100% | 2012 |
| South Dakota | 141 | 141 | 100% | 2002 |
| Vermont | 87 | 87 | 100% | 2001 |
| Virginia | 420 | 420 | 100% | 1996 |
Before 20002000–20092010–20182019–202020212022–2023
“Typical year joined” is the median start year among each state’s agencies on NIBRS; the dot uses the map’s colors. Source: FBI Crime Data Explorer agency list via TidyTuesday (Feb. 18, 2025). The bar’s pink remainder is agencies not yet on NIBRS. Washington, DC, isn’t included.
Methodology and sources
- Agencies: FBI Crime Data Explorer agency list, as compiled for TidyTuesday (February 18, 2025). It covers the 50 states, with 19,166 agencies, each with a NIBRS flag and start date. Agencies may have switched since then.
- Coloring: Agencies marked as on NIBRS are colored by the year of their start date. All others count as “not on NIBRS.” Thirty-six agencies marked “not on NIBRS” had start dates in early 2024, apparently scheduled switches; the map follows the NIBRS flag. No agency on NIBRS had a 2024 start date. One agency, in Aurora, Colorado, lists a 1985 start, which is probably a data error; it falls in the “Before 2000” group either way. Washington, DC, isn’t in the dataset.
- Locations: The FBI lists approximate coordinates. We used them when they fell inside the agency’s own state. For 1,905 agencies with missing or out-of-state coordinates, we placed the dot near the center of the agency’s county, with a small random offset. Another 119 agencies had no county and don’t appear on the map. They still count in the state percentages.
- Coverage figures: Congressional Research Service, “The National Incident-Based Reporting System (NIBRS): Benefits and Issues” (R46668, updated July 2025).
- Boundaries: US Census Bureau state outlines via the us-atlas package.