
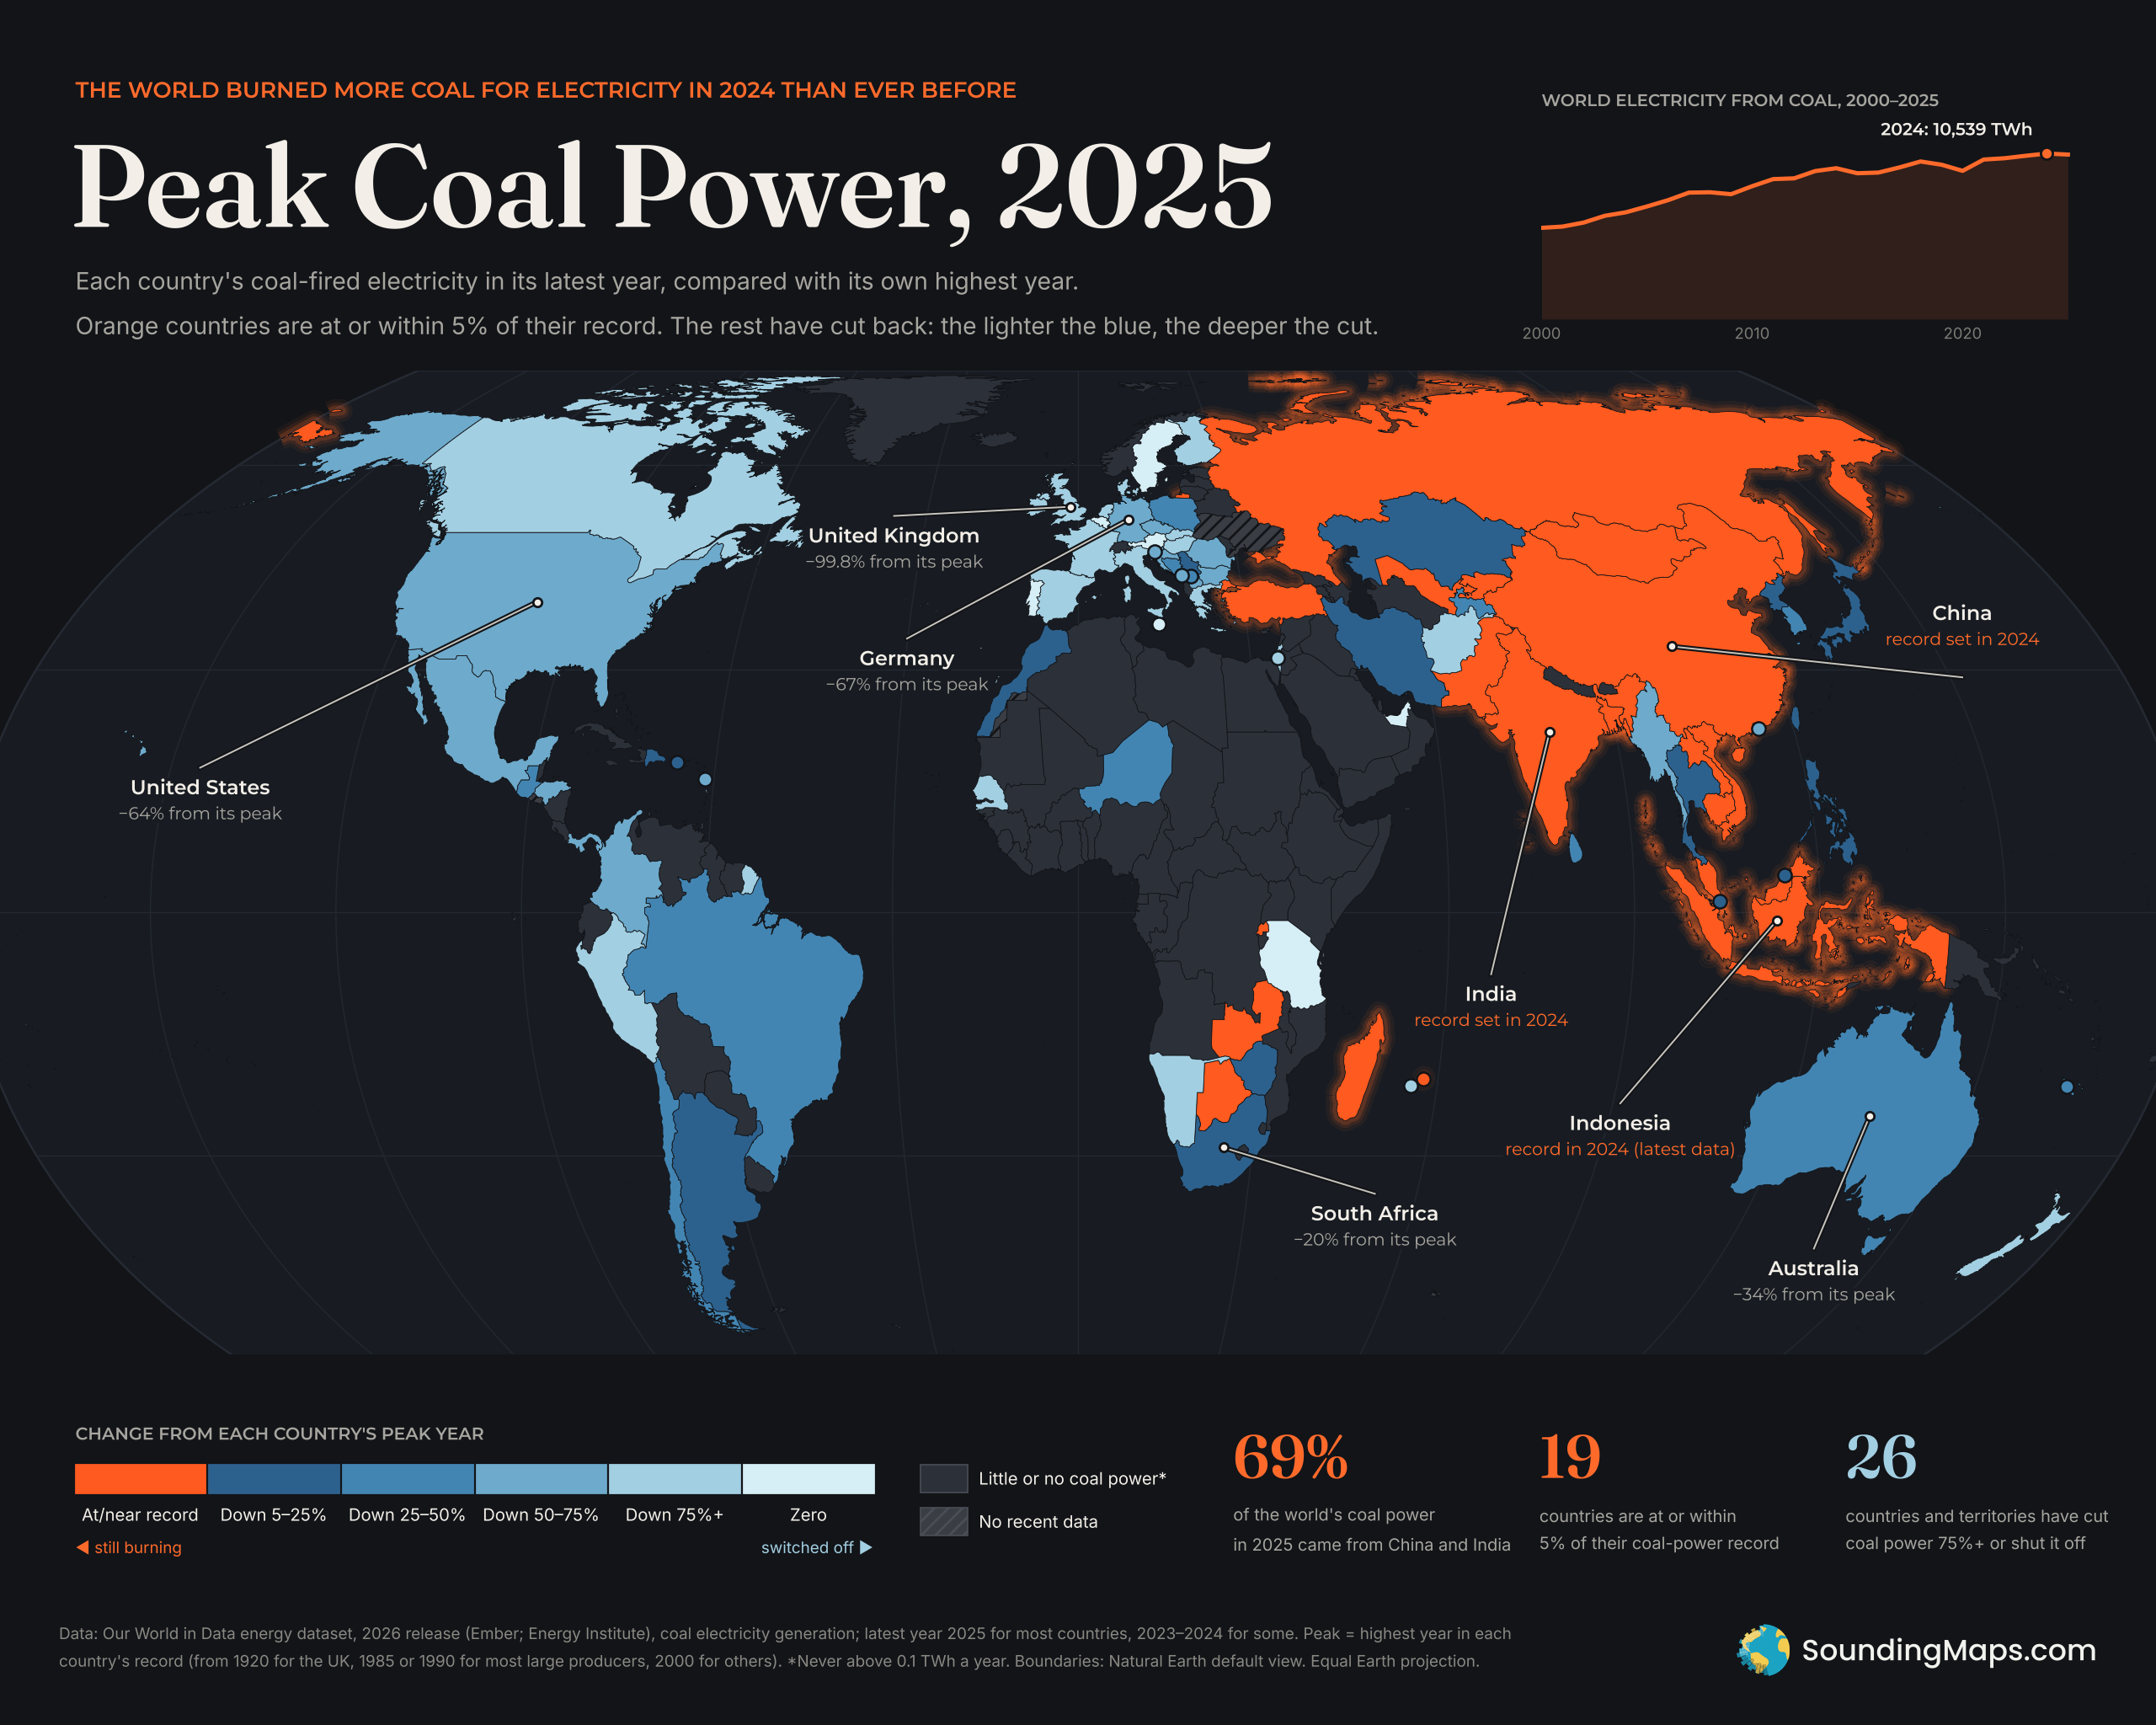
The world burned more coal for electricity in 2024 than in any year before. That record came to about 10,540 terawatt-hours, according to Ember and Energy Institute data compiled by Our World in Data. Coal generation slipped a little in 2025, by less than 1%.
Behind that global total, countries are moving in opposite directions. This map shows each country’s latest coal generation compared with its own highest year on record.
What the map shows
Each country gets one color based on a simple ratio. We took its coal-fired electricity in the latest year with data, usually 2025. Then we compared it with the largest yearly figure in its record.
Orange marks countries at their record or within 5% of it. Every other color is a cut. Deep blue means a small one, and the blue gets lighter as the cut deepens. The palest blue marks countries that produced no coal power at all in their latest year. Dark grey countries have little or no coal power.
Asia is still near the top
China and India both set records in 2024. In 2025 China dipped 1.3% and India dipped 2.9%. Both moves are too small to call a peak.
Together those two countries produced about 69% of the world’s coal power in 2025. Indonesia’s latest figure is from 2024, when it set a record. Its state utility, PLN, reports that its plants burned 9.3% more coal in 2025, so another record looks likely. Vietnam, Malaysia, Pakistan, Bangladesh and Mongolia also sit at or near their highs. So do Turkey and Russia. Russia’s coal output has crept up over the last decade, reaching about 220 TWh in 2025.
Europe and North America have fallen furthest
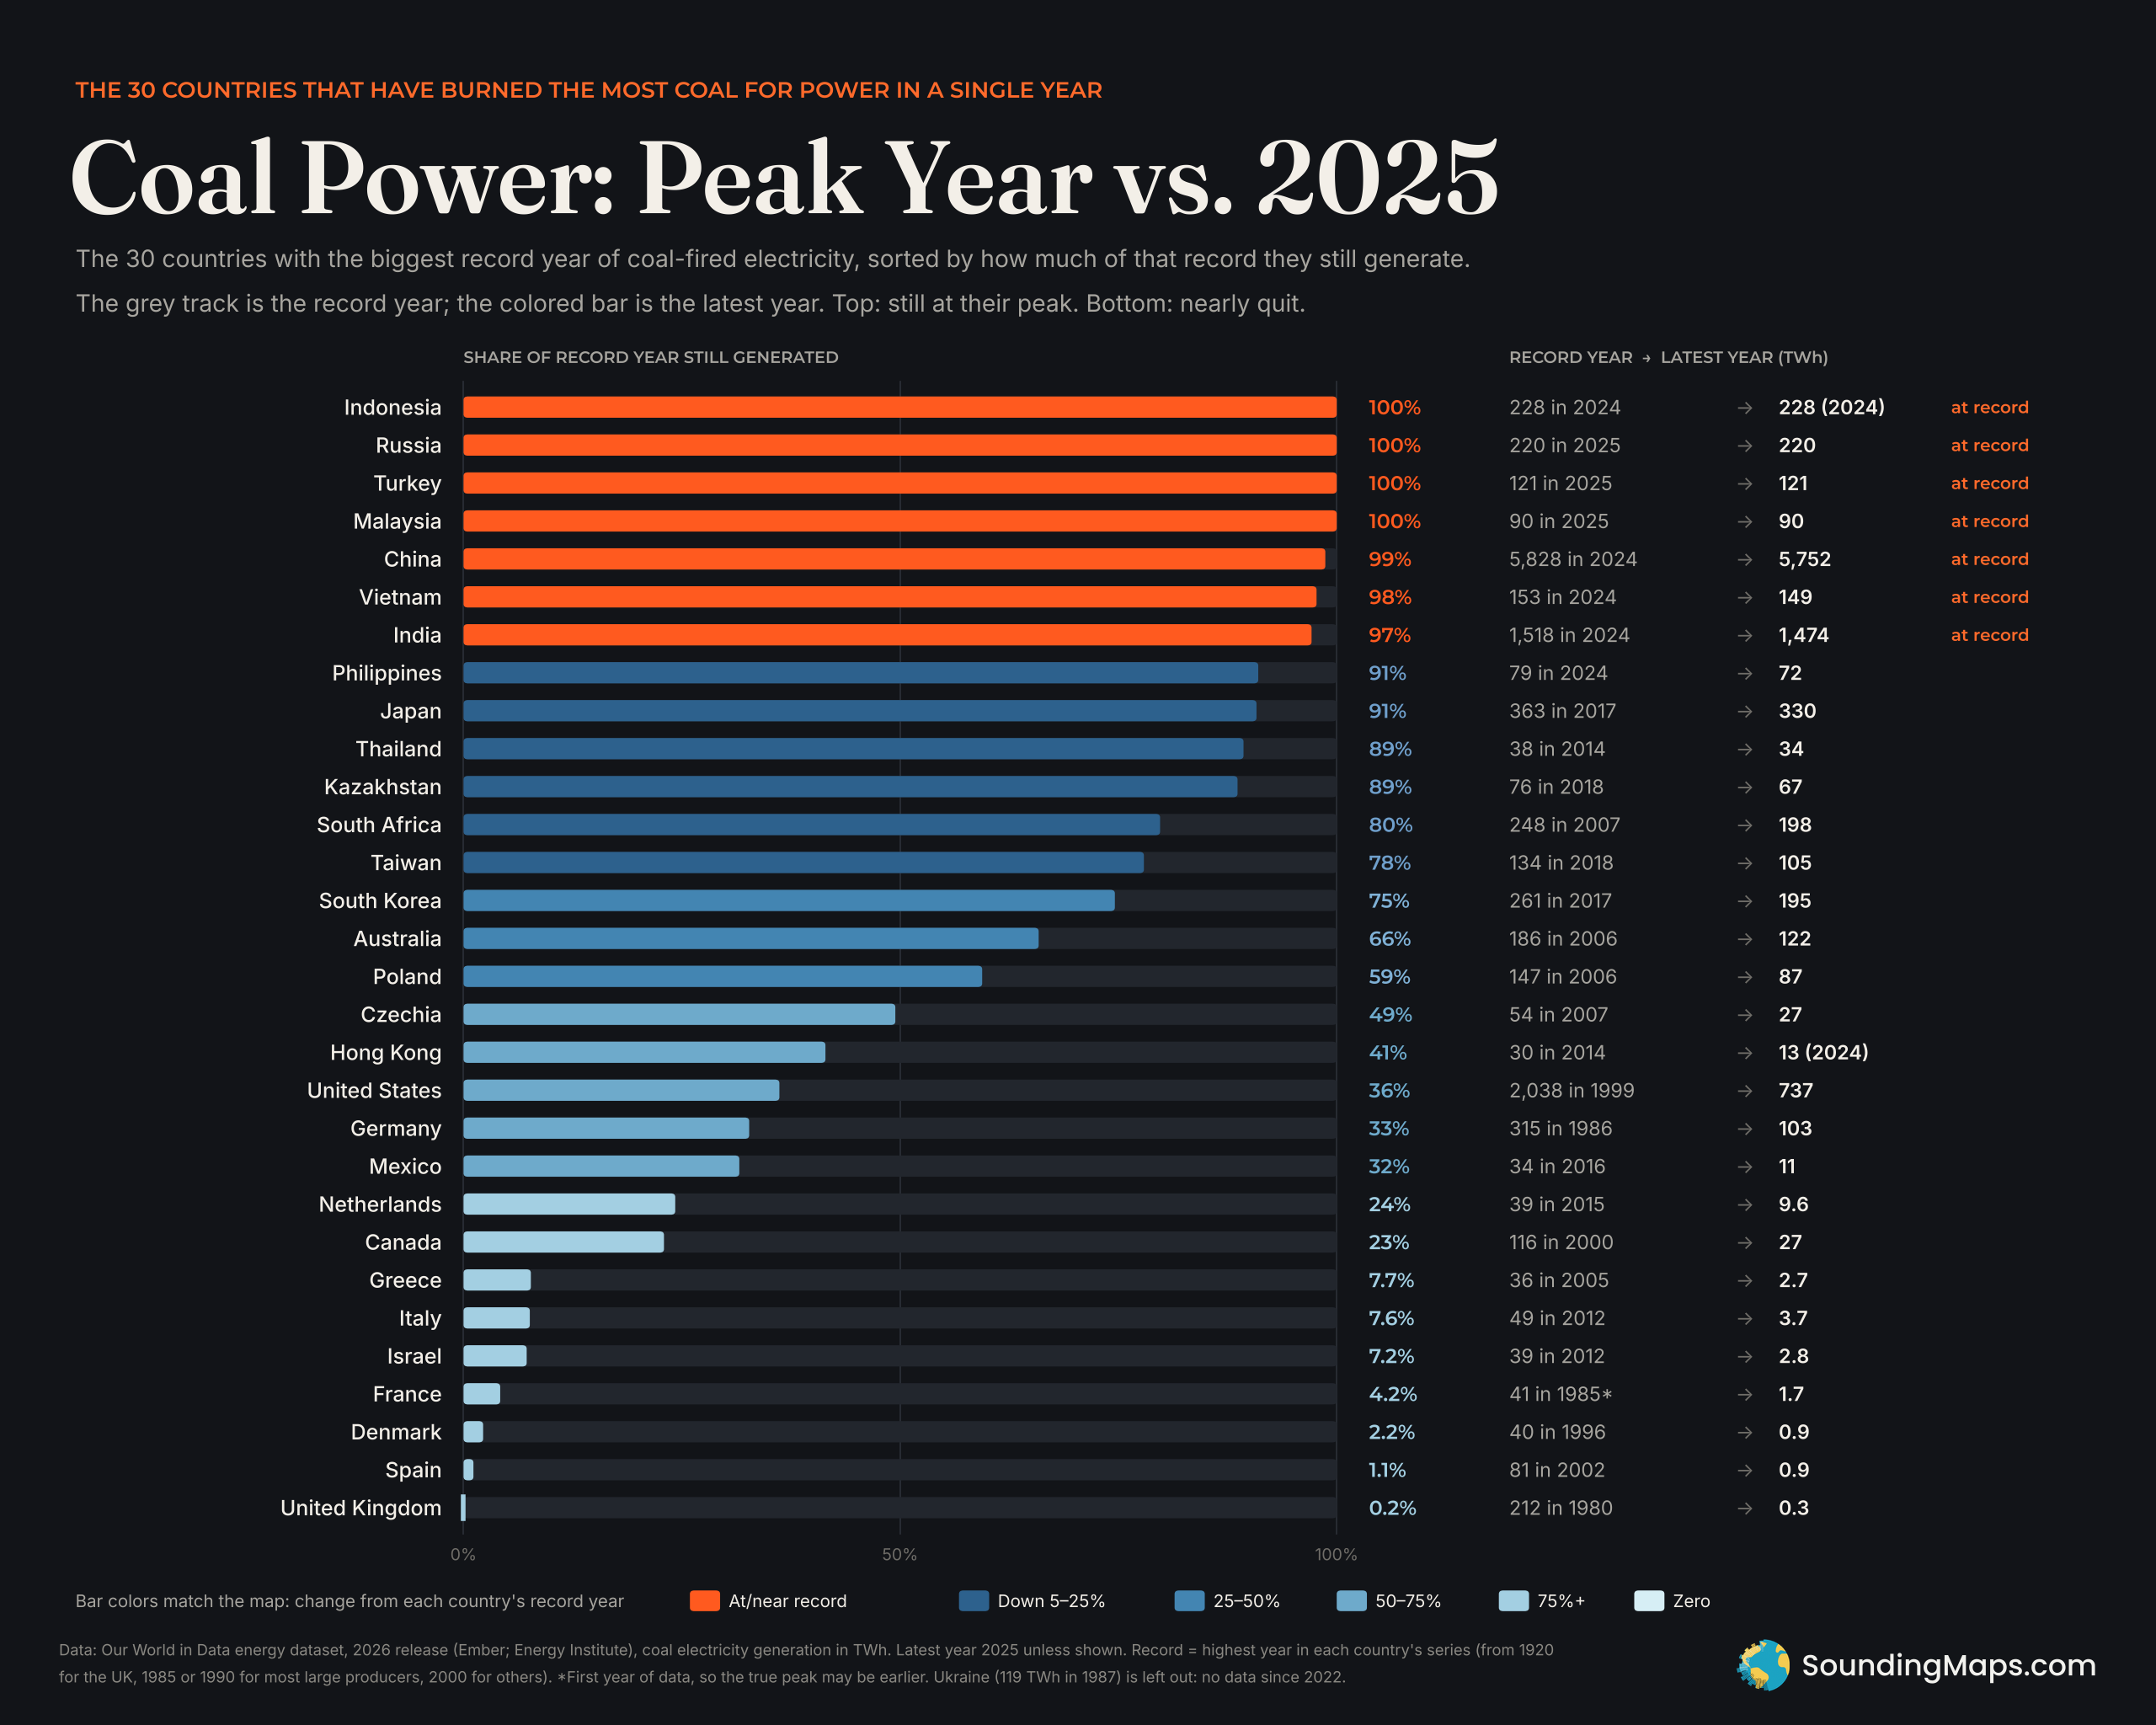
The United Kingdom built the first public coal power station in 1882. It closed its last coal plant, Ratcliffe-on-Soar, in September 2024. The data still shows a sliver of coal generation in 2025, about 0.3 TWh, likely from small or industrial sources. That leaves the UK 99.8% below its peak.
Belgium, Portugal, Austria, Sweden and Malta report zero coal power in their latest year. Spain, Denmark, Finland and Ireland are all down by more than 97%.
The United States has cut coal generation by 64% from its peak. Germany is down 67%. Canada’s coal power has fallen 77% since 2000. Ontario closed its last coal plant in 2014, and Alberta followed in 2024.
The middle of the pack
Some big coal users have only started to fall. Japan is 9% below its 2017 high. South Africa is down 20% from 2007, and Australia is down 34% from 2006. Poland and South Korea have cut coal power by roughly two-fifths and a quarter.
Latin America is mixed. Brazil and Chile are each down 36–48% from their mid-2010s highs, and Mexico is down 68%. Argentina sits only 6% below its 2010 peak.
Why some countries look odd
Small producers can swing a lot in one year. Colombia leaned on coal during a 2024 drought, then cut it by about half in 2025. That puts it in the 50–75% band even though its record is recent.
The United Arab Emirates shows as phased out. Its only coal plant, Hassyan near Dubai, has been converted to run on gas.
Kosovo gets almost 90% of its power from lignite. Its coal generation fell 26% in 2025 from its 2021–2022 high.
The data also has gaps. Ukraine’s figures stop in 2022, so it appears in grey. El Salvador and a few small territories also lack a coal series.
Estonia may surprise some readers. Its power plants long ran on oil shale, a fuel this data counts as oil rather than coal. That puts Estonia in the “little or no coal” group.
Methodology and sources
Data comes from the 2026 release of Our World in Data’s energy dataset. It combines Ember’s electricity data with the Energy Institute’s Statistical Review of World Energy. We used the coal_electricity_twh series.
Each country’s latest year is its most recent one with data. That is 2025 for most and 2023 or 2024 for some. The peak is the highest single year in each country’s record. That record starts in 1920 for the UK, 1985 or 1990 for most large producers, and 2000 for many others. A country that peaked before its data begins may therefore look like it peaked later.
Seven of the 19 countries at or near their record have data only through 2024. They are Indonesia, Laos, Botswana, Zambia, Madagascar, Mauritius and Rwanda.
Peak years for a few countries depend on which source you use. The Energy Institute series puts the US high point in 1999. By contrast, the US Energy Information Administration puts it in 2007. Both put the current decline at roughly two-thirds, so the US lands in the same color either way.
We classed countries by percentage change from peak: within 5%, down 5–25%, 25–50%, 50–75% and more than 75%. “Phased out” means exactly zero generation in the latest year. Countries that never topped 0.1 TWh a year appear as “little or no coal power.” For 116 of them, the data shows zero coal generation in every year. Five others had trace amounts: Belarus, Estonia, Georgia, Norway and Eswatini. Norway’s came from a small plant on Svalbard. Réunion and Guadeloupe, which are part of France, appear as dots. Small countries with coal power also get dots so they stay visible.
Boundaries come from Natural Earth’s default world view. The map uses the Equal Earth projection.

