The Wettest Month: Every US County’s Rainiest Month of the Year, Mapped
Ask someone in Los Angeles when the rainy season is and they’ll say winter. Ask someone in Phoenix and they’ll say summer. Ask in Atlanta and you’ll probably get a shrug. All three are right, and this map shows why.
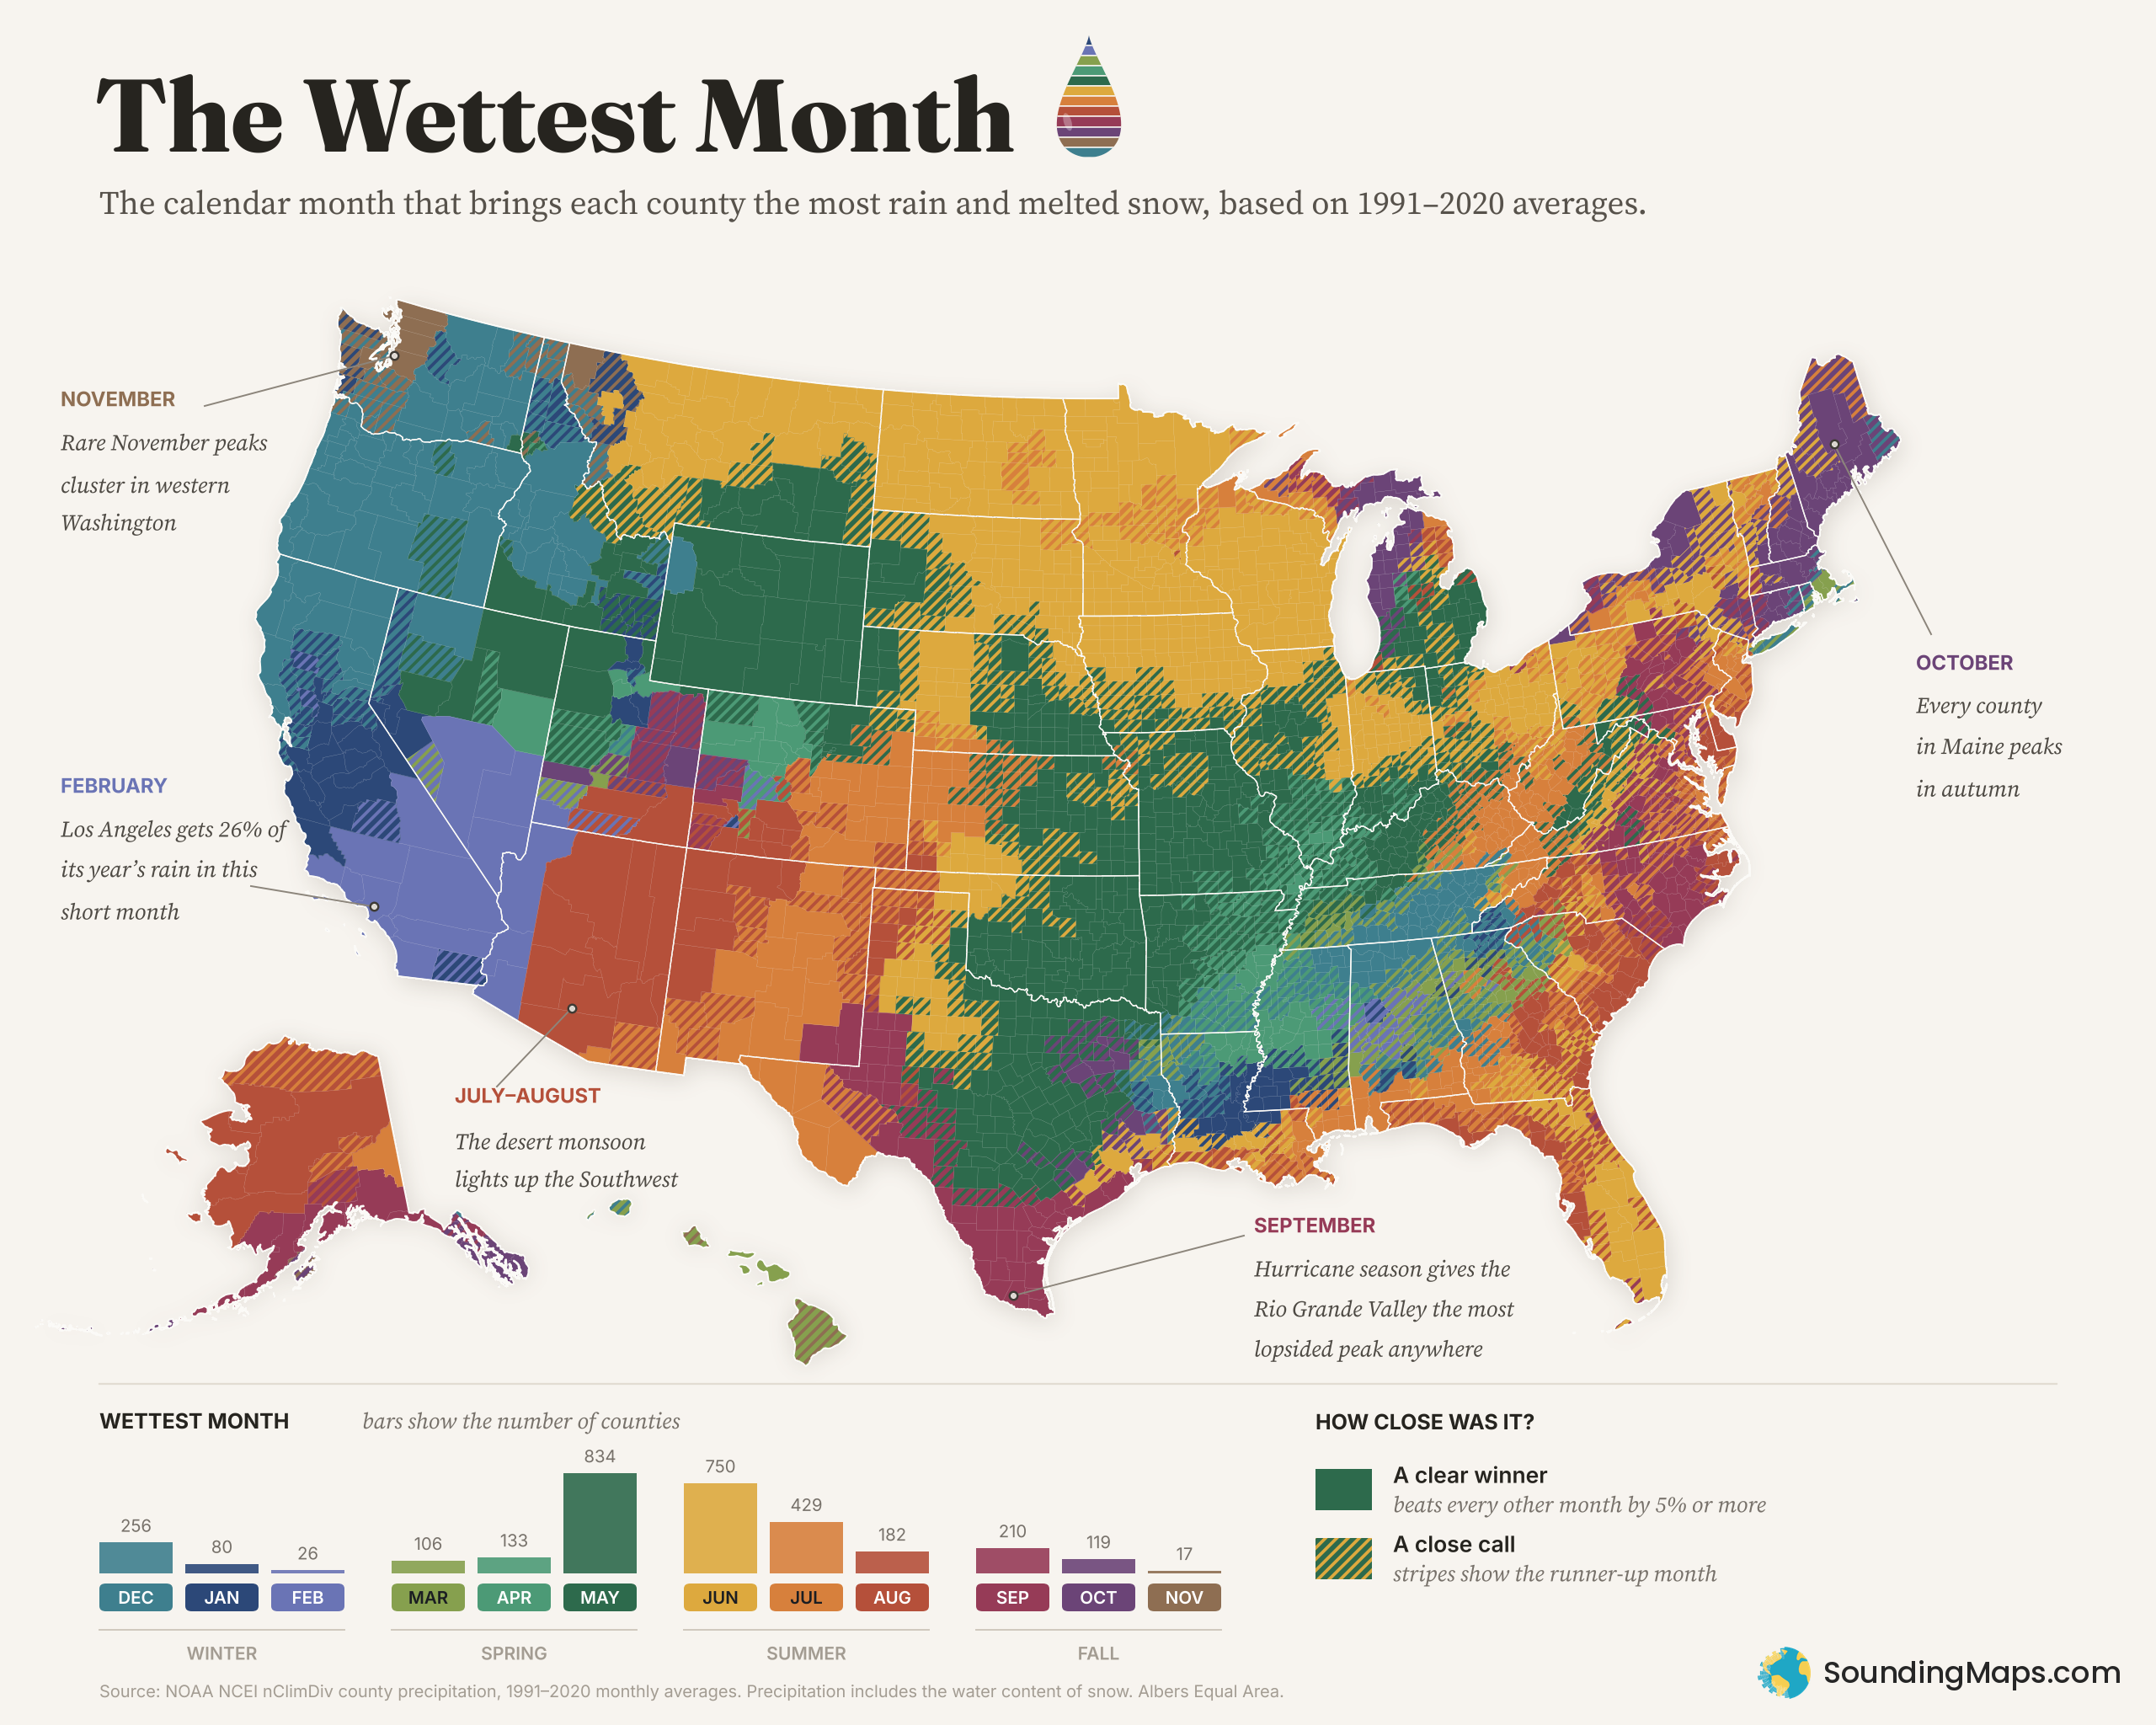
Each of the 3,142 counties and county equivalents on the map is colored by the calendar month that, on average from 1991 to 2020, brought it the most precipitation (rain plus the water in melted snow). It turns out America doesn’t have one rainy season. It has at least six.
Six rainy seasons
The Pacific winter. From Seattle to San Diego, and inland across much of Nevada, the wettest months land between November and February, when Pacific storms roll ashore. Seattle’s King County peaks in November. Portland’s Multnomah County peaks in December. Southern California and Las Vegas peak in February. That’s the shortest month of the year, and it still wins. February alone brings Los Angeles County about 26% of its yearly total, the most concentrated rainy month of any county on the map.
The Plains in late spring. The big green block from Texas to Nebraska is May, the peak of thunderstorm season, when warm Gulf moisture runs into cooler air from the north. Oklahoma County, Kansas City and San Antonio all peak in May. Head north and the peak slides into June (the gold zone), covering the Dakotas, Minnesota, Iowa, Wisconsin and most of Montana. Fargo’s Cass County gets about 17% of its precipitation in June alone.
The desert monsoon. Arizona and New Mexico glow orange and red for July and August. That’s the North American Monsoon, when summer winds shift and pull moisture up from the south and fuel afternoon storms. Phoenix is a good example of how close it can be: August beats February there by only about 7%. The desert gets two small rainy seasons, and in Phoenix the summer one just barely wins.
The hurricane coast. Along the lower Rio Grande, September dominates by a wider margin than anywhere else in the country. In Starr, Zapata, Hidalgo and Cameron counties, September brings 67–78% more rain than the next-wettest month, which is what you’d expect at the peak of tropical storm season. Coastal Carolina leans toward August and September too, and South Florida peaks in June at the start of its summer wet season.
The autumn Northeast. Every county in Maine, nine of New Hampshire’s ten, much of upstate New York and a band of northern and western Michigan in the lake-effect belt along Lake Michigan peak in October. Portland, Maine’s Cumberland County gets about 18% more precipitation in October than in June, its runner-up.
Alaska’s late summer and fall. Alaska does its own thing. Almost the entire state peaks between August and October, as the fall storm season sets in. Anchorage and Juneau both peak in September, Juneau by a wide 25%. Much of the southeast panhandle waits until October: Ketchikan and Sitka both peak then. Fairbanks and the North Slope peak in August, but only barely. There are two exceptions: Skagway peaks in December, and the Southeast Fairbanks Census Area in July.
And Hawaii? All five Hawaii counties peak in March. That’s a real pattern, but county averages hide a lot here, because each county is a whole island or island group. The wet windward slopes and the dry leeward coasts get blended together. Three of the five counties are close calls.
The striped counties: a coin flip
You’ll notice a lot of the map, especially in the East and South, is striped. Those are close calls, where the wettest month beat the runner-up by less than 5%. The base color is the winning month, and the stripes are the runner-up, so a green county with gold stripes means May, with June right behind. That’s 1,476 counties, or 47% of the total.
East of the Mississippi, rain tends to be spread fairly evenly through the year, so “the wettest month” is often a photo finish:
- Atlanta (Fulton County): March edges out July by about 1%.
- Memphis (Shelby County): April beats March by less than half a percent.
- Boston (Suffolk County): December beats October by about 1%.
- Chicago (Cook County): May beats June by about 1%.
In places like these, a few extra-stormy years in the record could flip the answer. If your county is striped, think of it as a tie for first between its two colors.
By the numbers
- May is the most common wettest month (834 counties), followed by June (750) and July (429).
- Summer months (June–August) are the wettest month in 43% of counties and spring in 34%. Winter and fall split the rest, at about 11% each.
- November is the rarest winner, with just 17 counties: 14 in Washington, mostly west of the Cascades, plus the Idaho Panhandle’s Boundary County and two counties in northwest Montana.
Methodology and sources
- Data: NOAA National Centers for Environmental Information (NCEI), nClimDiv county-level monthly precipitation (
climdiv-pcpncy-v1.0.0-20261006). nClimDiv county values are area averages derived from NOAA’s nClimGrid, a gridded dataset built from thousands of weather stations. - Calculation: For each county, I averaged the monthly precipitation totals for each calendar month across 1991–2020 (30 years, matching NOAA’s current climate-normals period) and picked the month with the highest average. These are simple averages of nClimDiv monthly totals, not NCEI’s official station-based Climate Normals. Months are compared by total precipitation, not by daily rate, so February, with its 28 or 29 days, is at a slight disadvantage, which makes its wins in Southern California and Nevada more impressive.
- Close calls: A county is striped when its wettest month beats its second-wettest month by less than 5%. The stripes are drawn in the runner-up month’s color.
- Alaska: The county boundaries used here predate Alaska’s 2019 split of the Valdez-Cordova Census Area into Chugach and Copper River, so the map shows the old area, using the average of the two new areas’ values. The inset leaves out the far western Aleutian Islands beyond the 180th meridian so the shape stays readable; their census area is still mapped. Alaska and Hawaii insets are not to scale.
- Special cases: nClimDiv files the District of Columbia under Maryland (code 18511 in NCEI’s county-to-climate-division crosswalk), so DC’s data comes from that record. Lexington city, Virginia isn’t listed separately, so it uses the values for Rockbridge County, which surrounds it.
- Boundaries: US Census Bureau county and state boundaries (via the us-atlas package), Albers Equal Area projection.