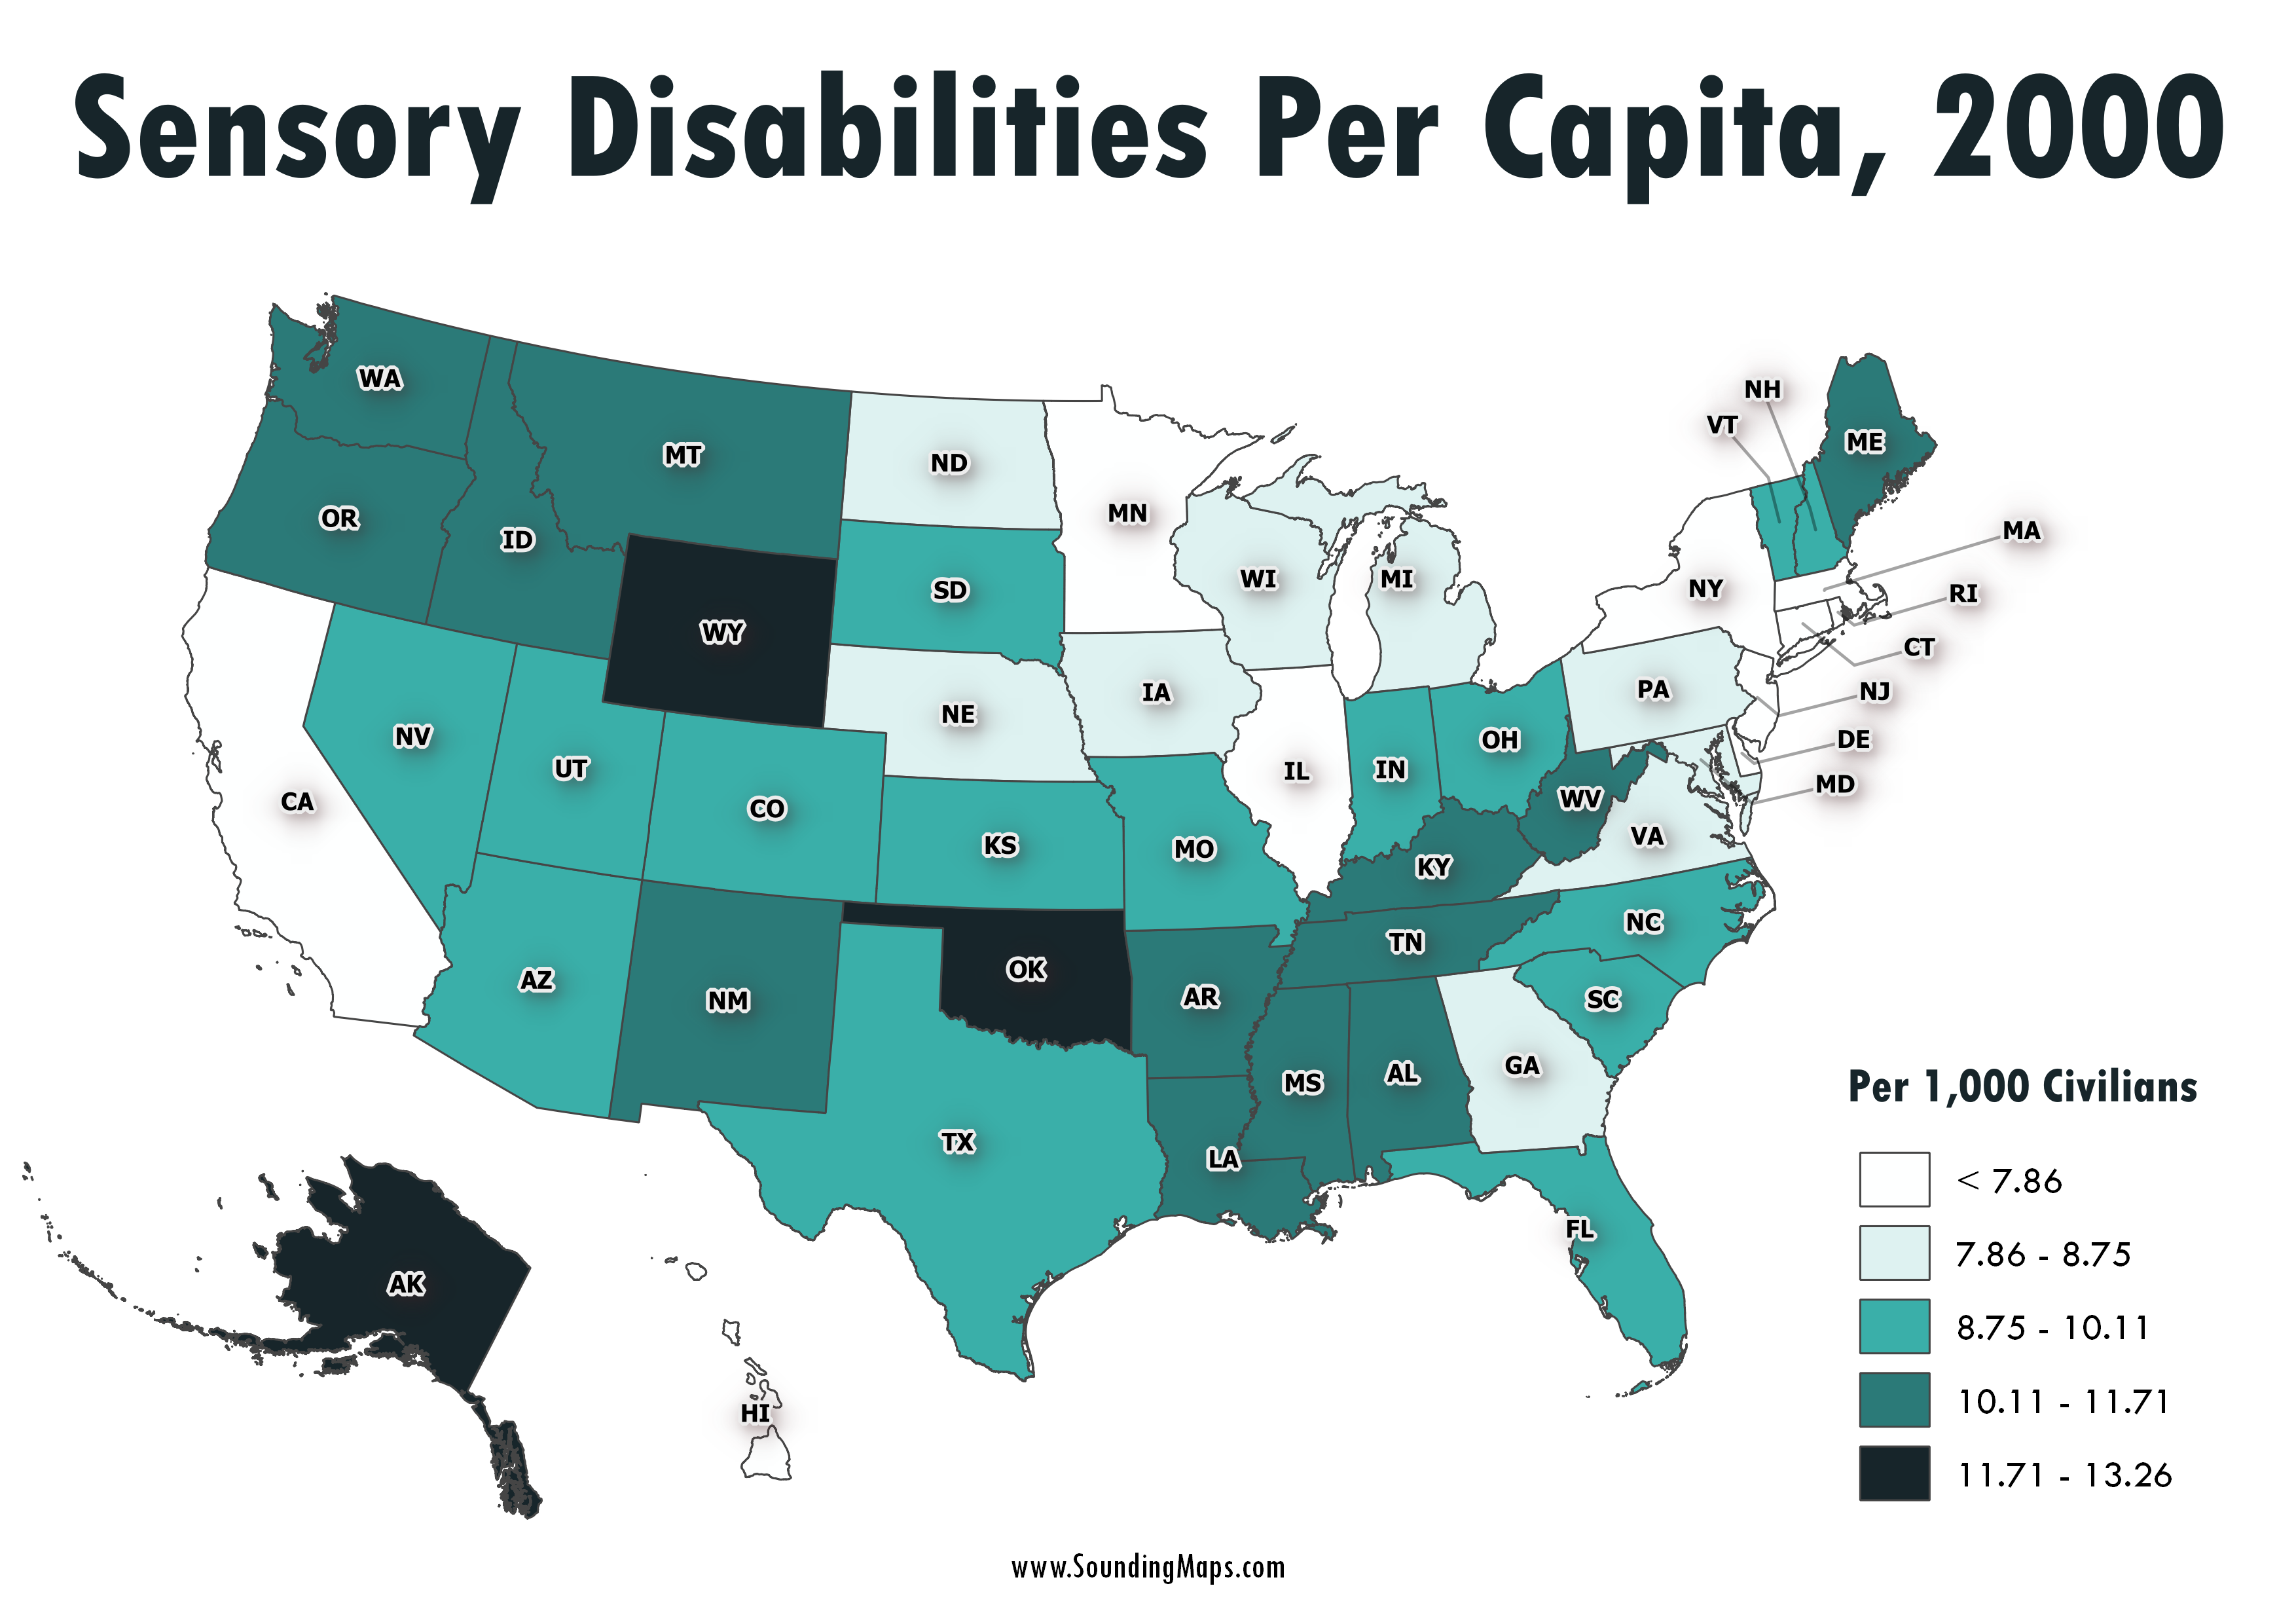
This map shows sensory disabilities throughout the United States in the year 2000. The color coded regions represent disabilities per 1,000 civilians. For instance, Alaska had 12.26 sensory disabilities per 1,000 citizens. Census 2000 counted 49.7 million people with some type of long lasting condition or disability. They represented 19.3 […]
Daily Archives: April 21, 2019
1 post

