Elevation Map of Mississippi
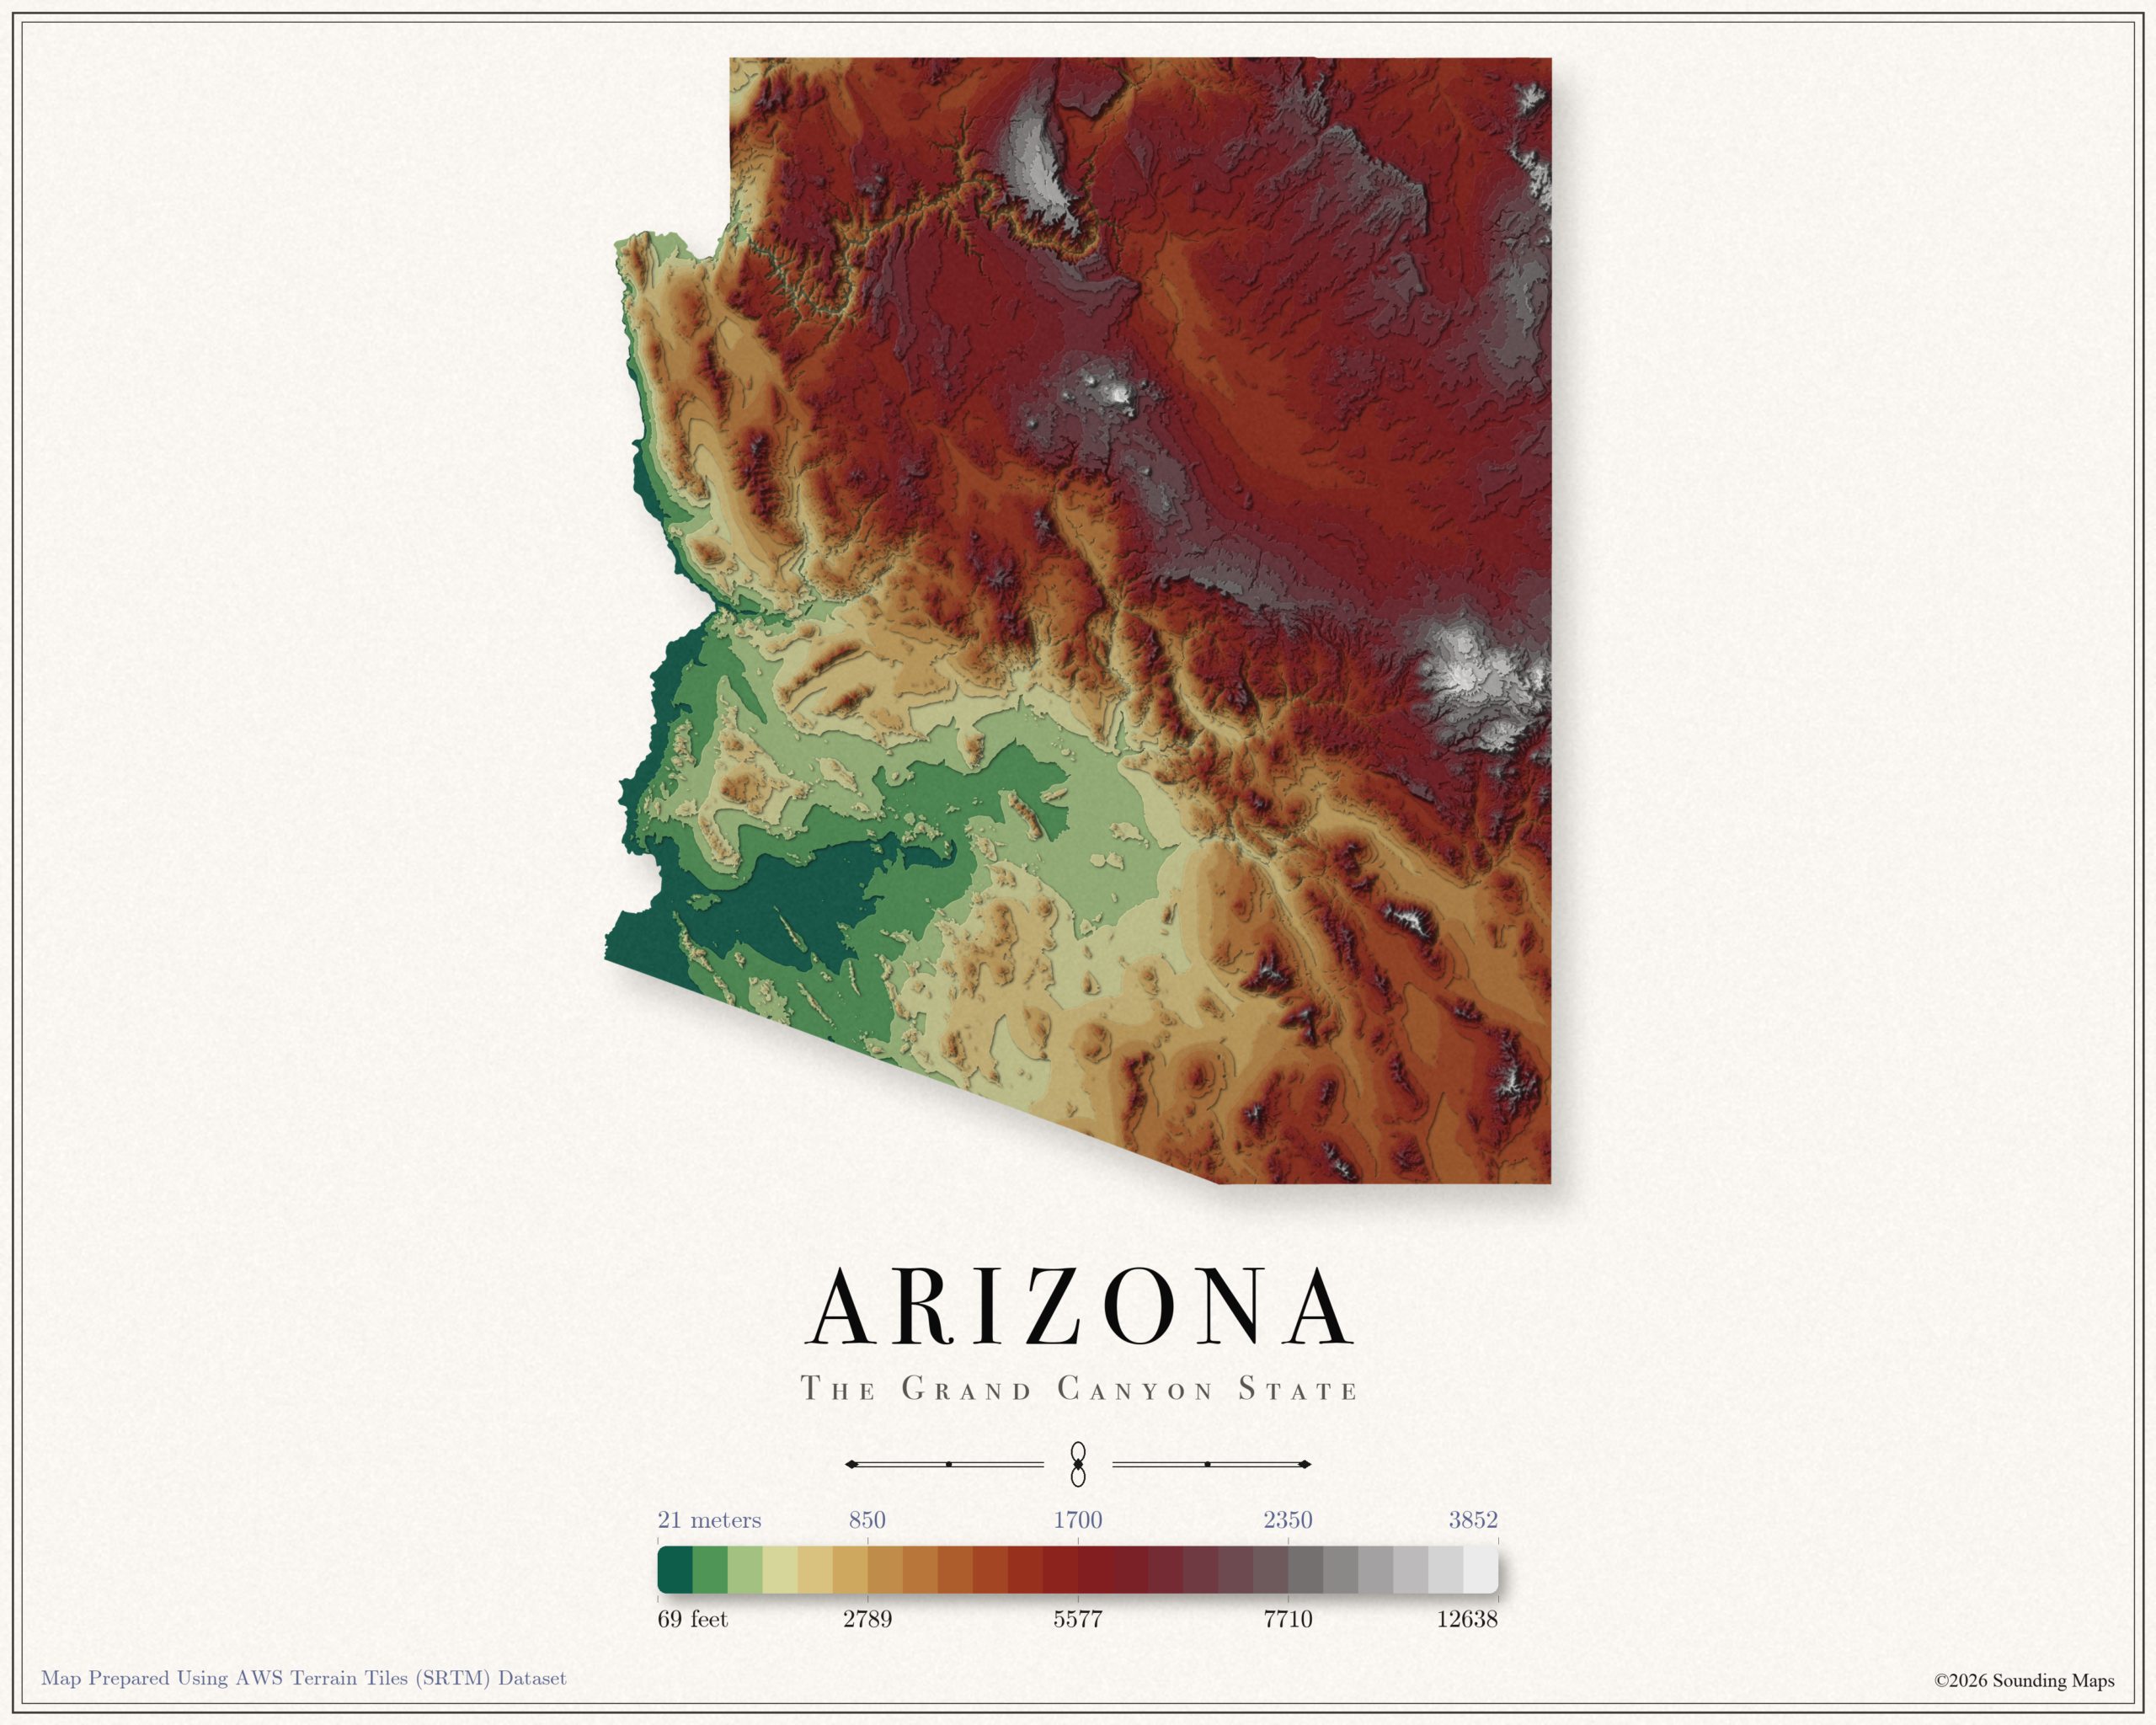
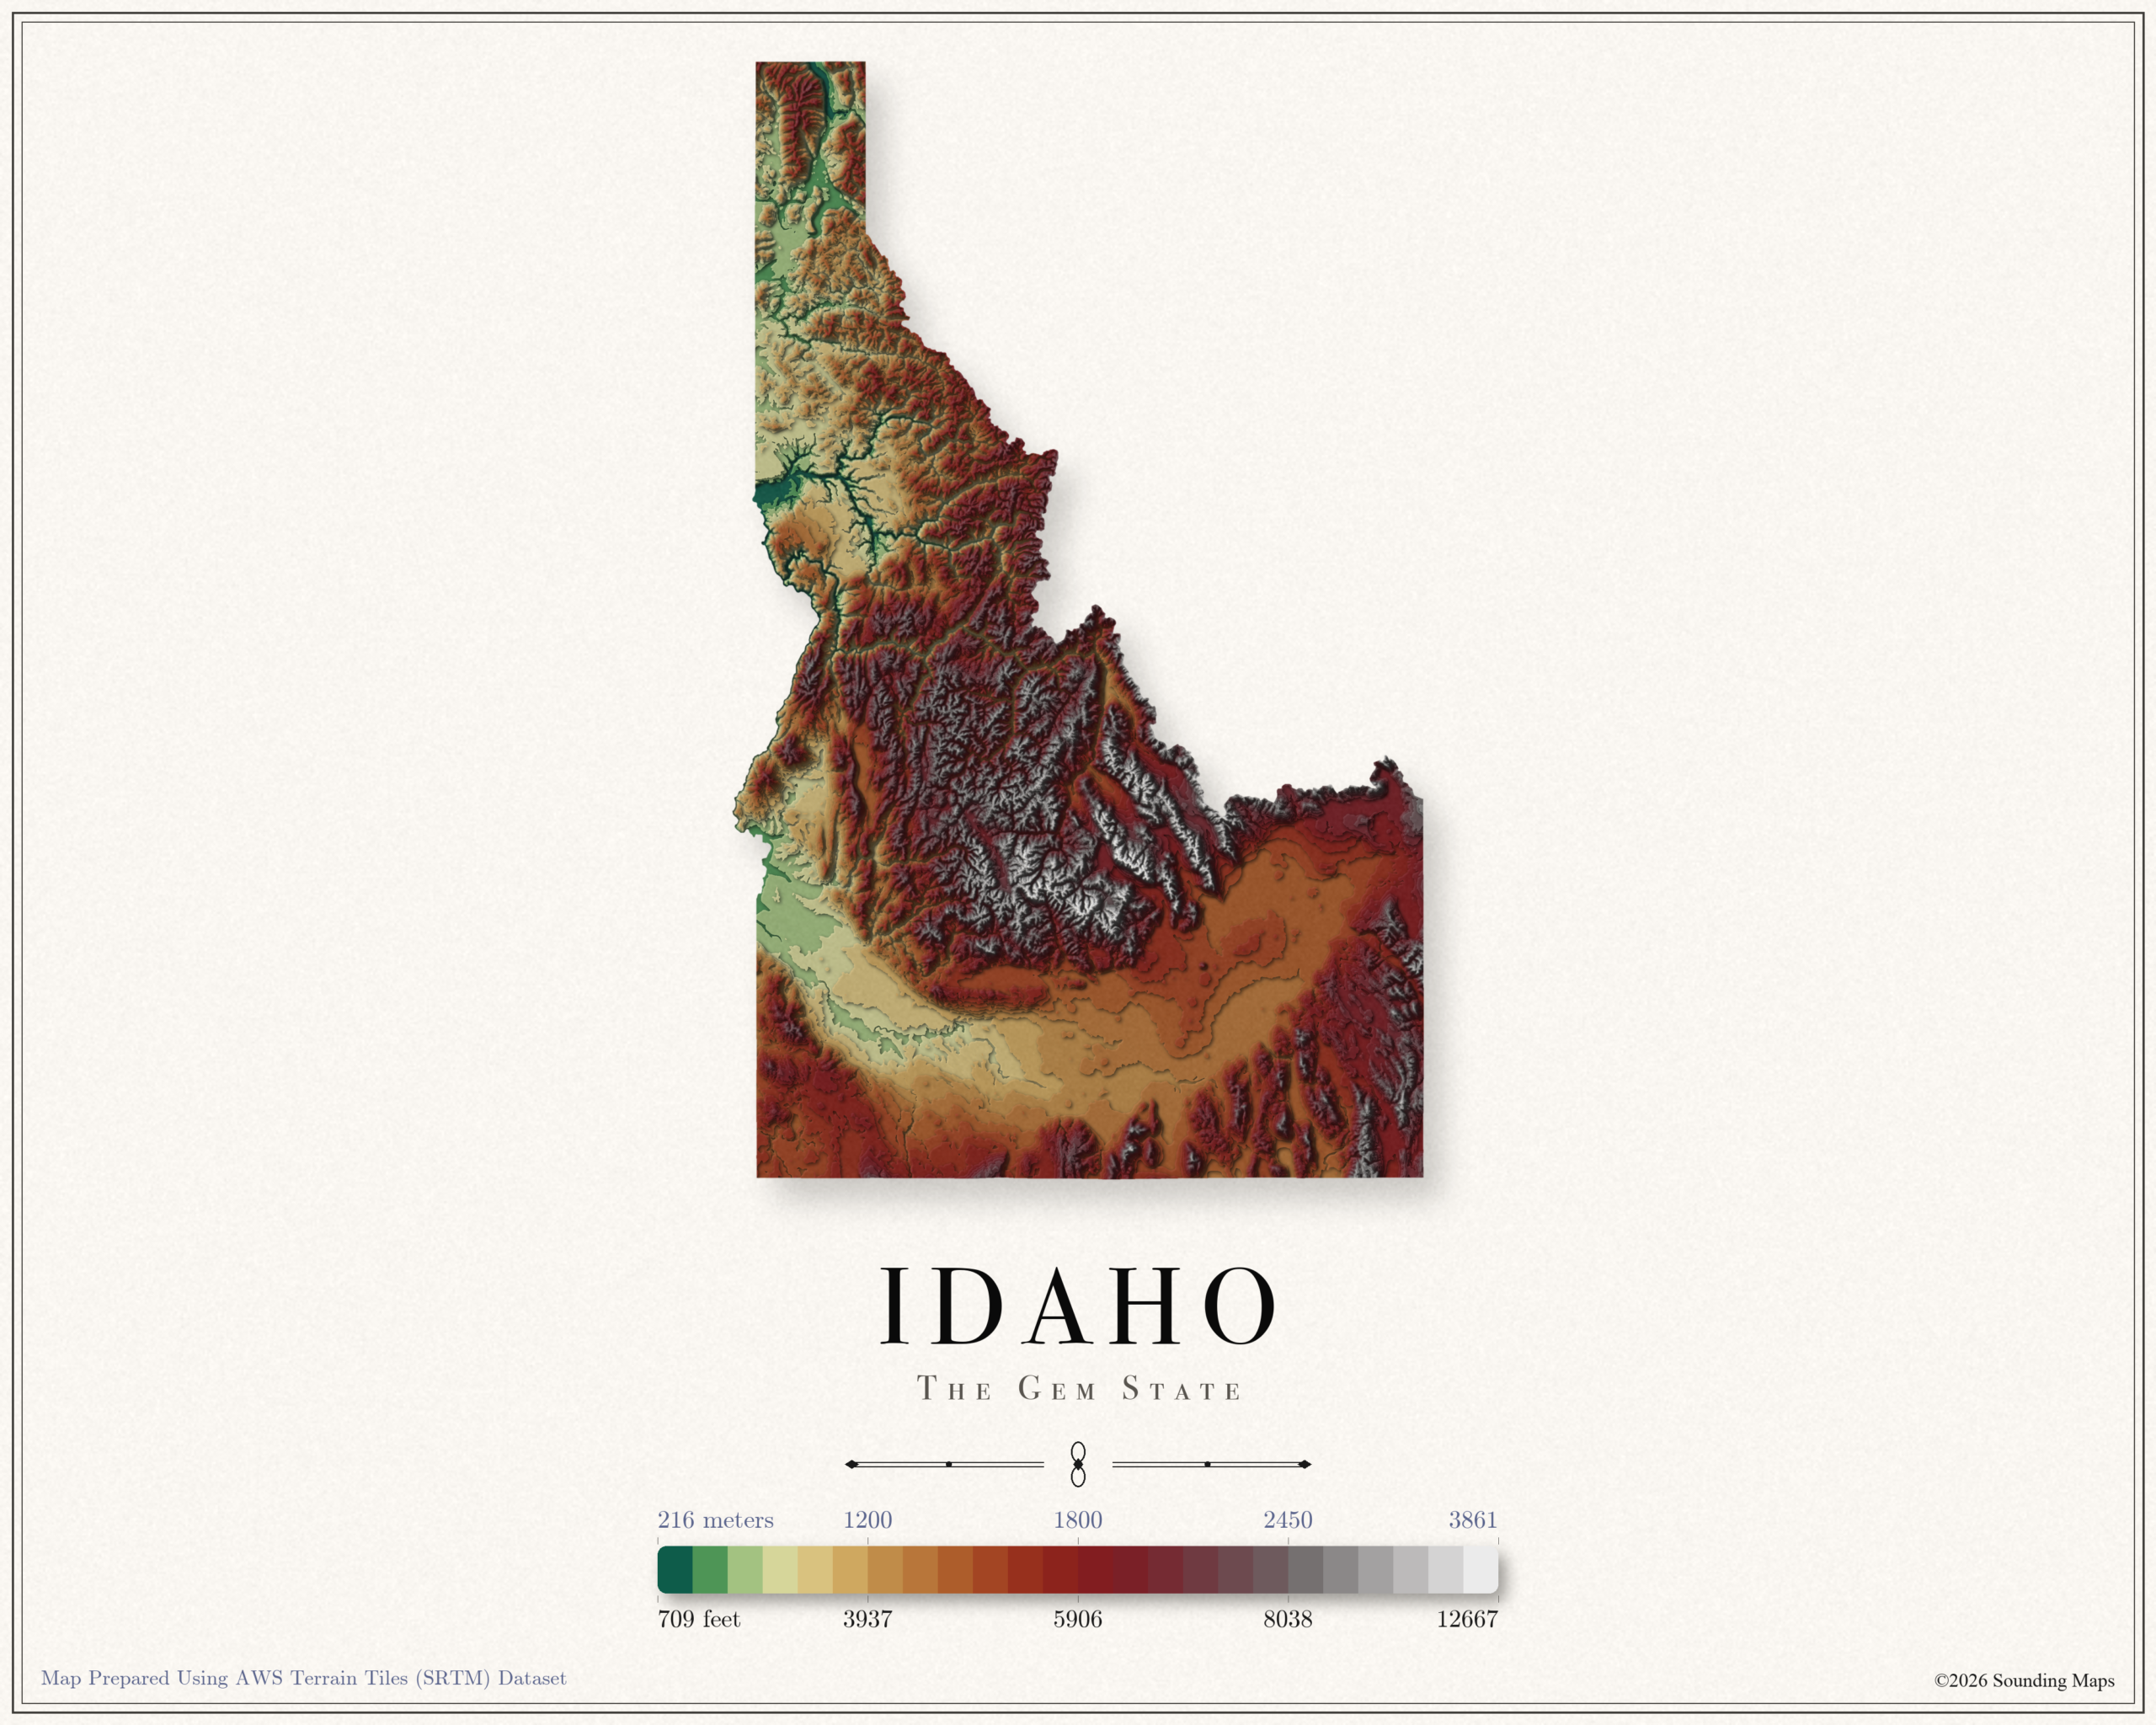
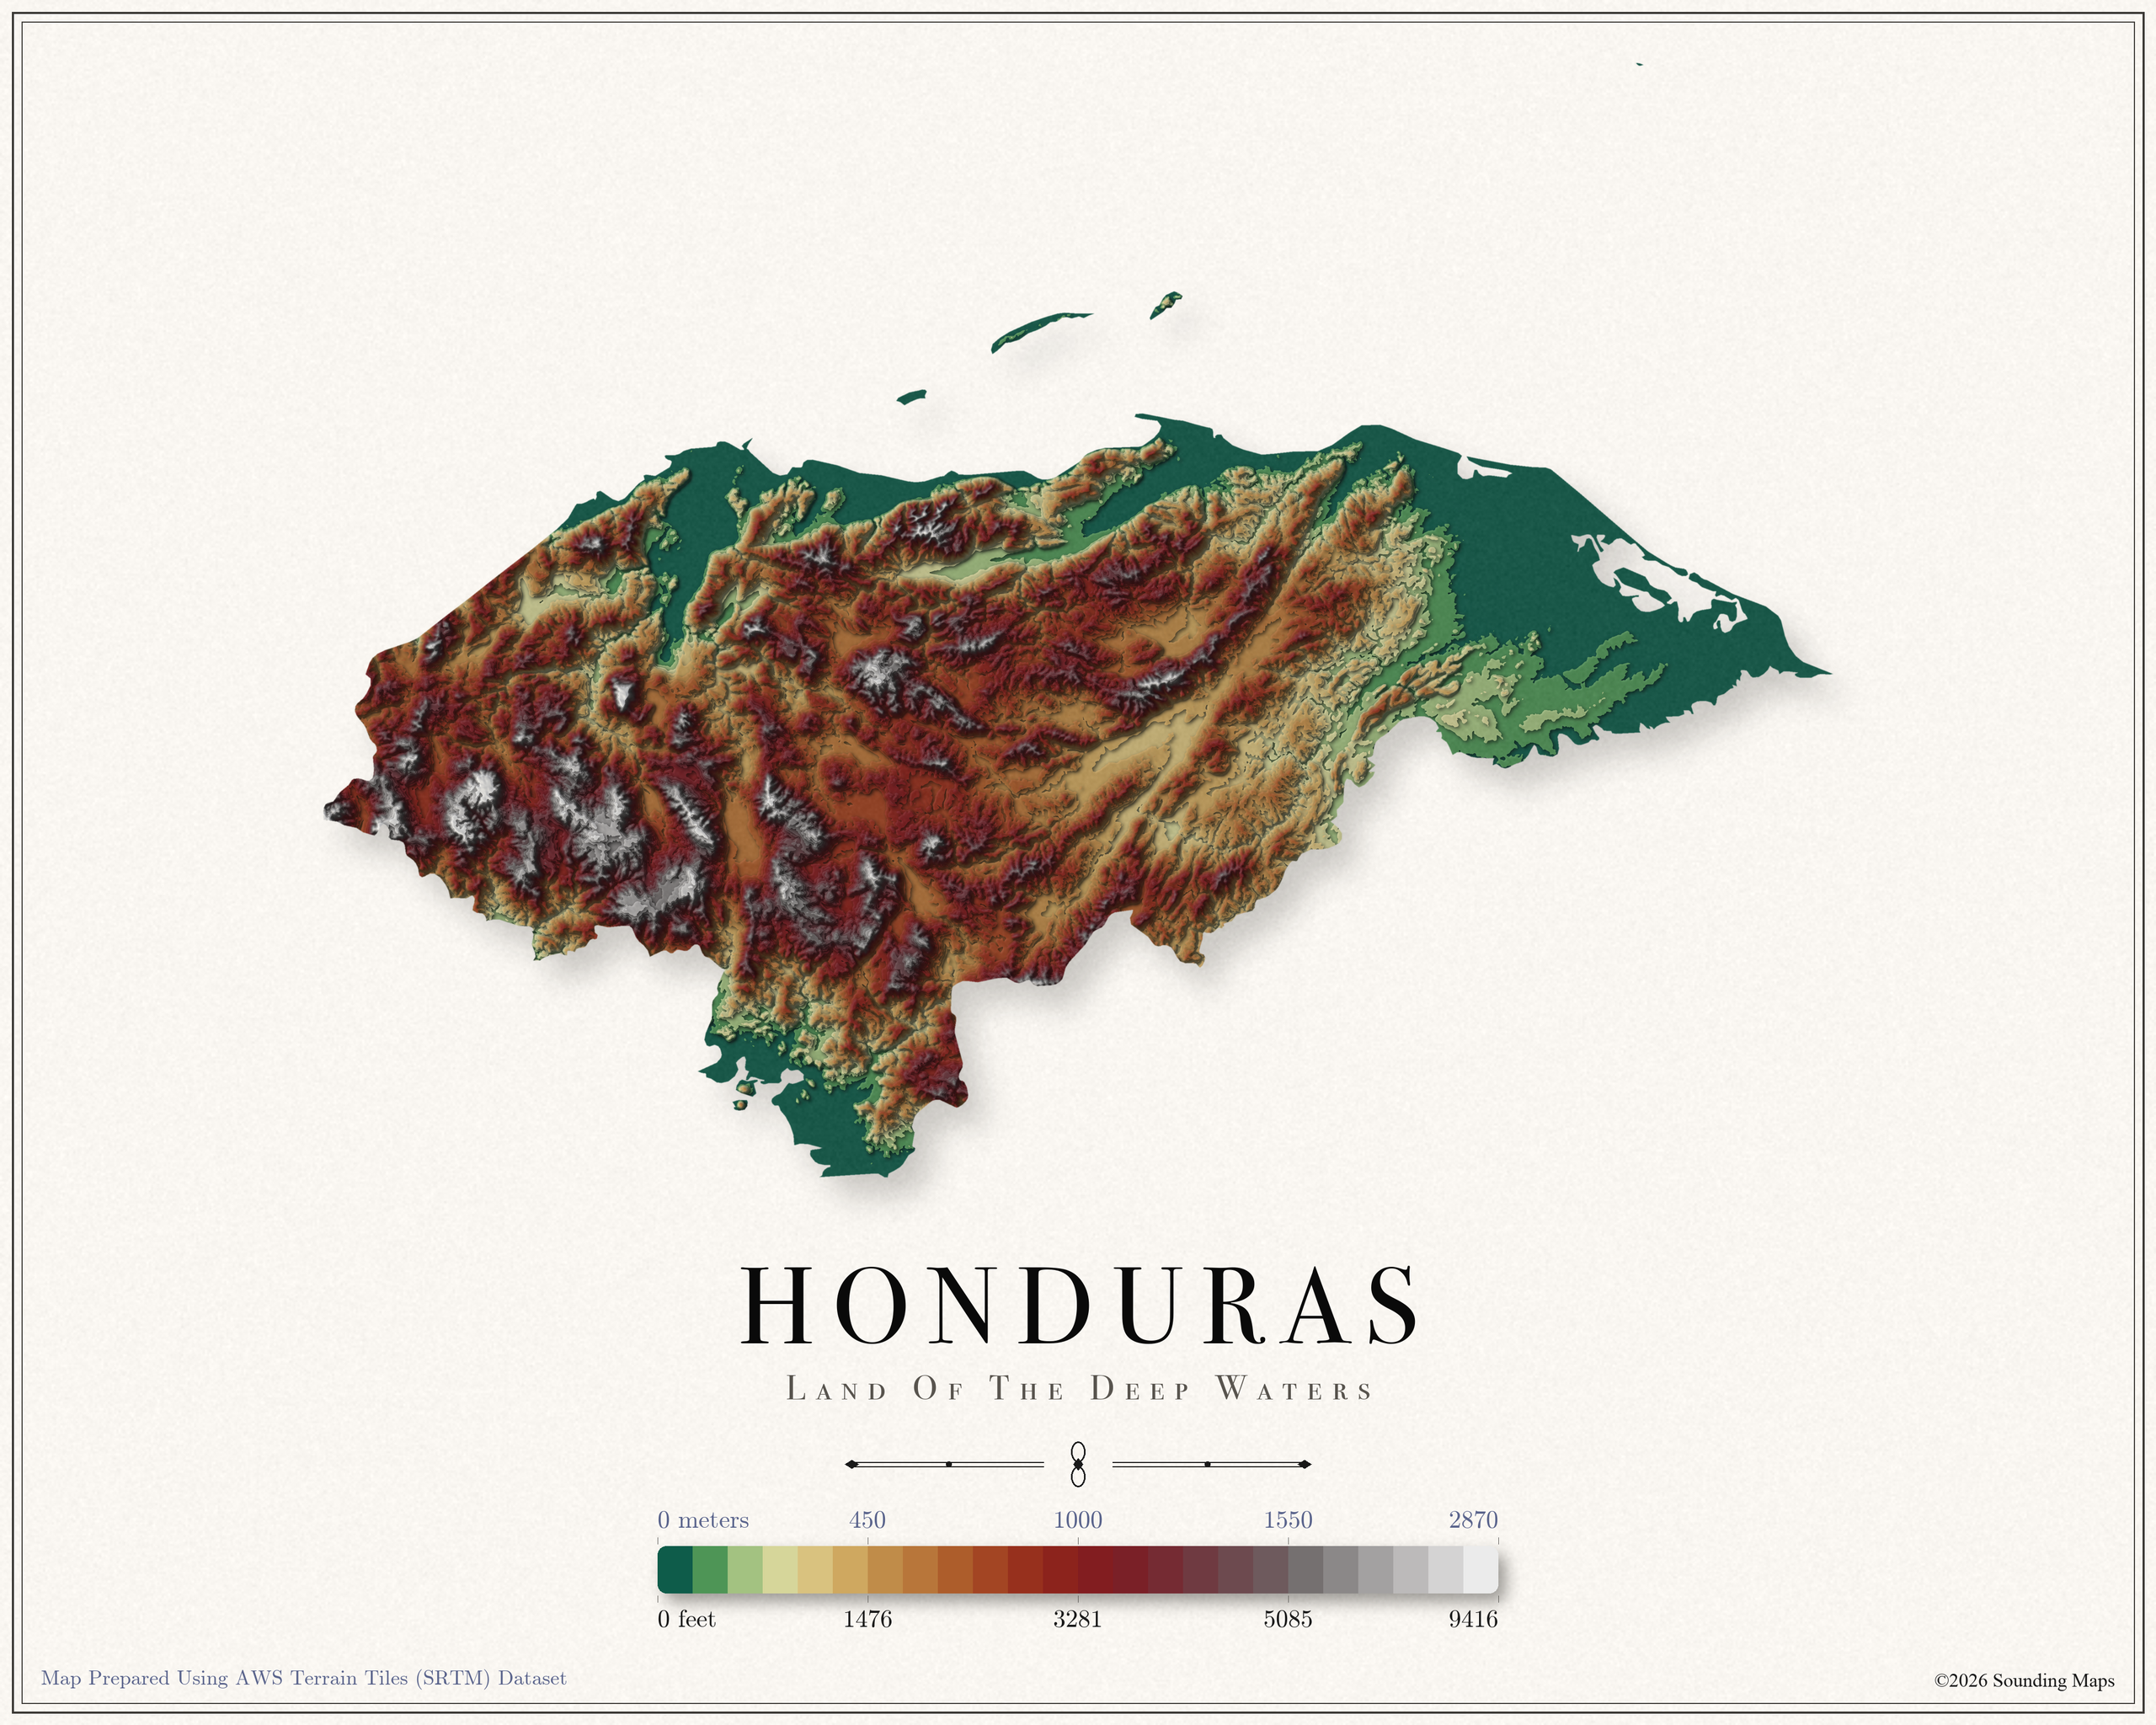
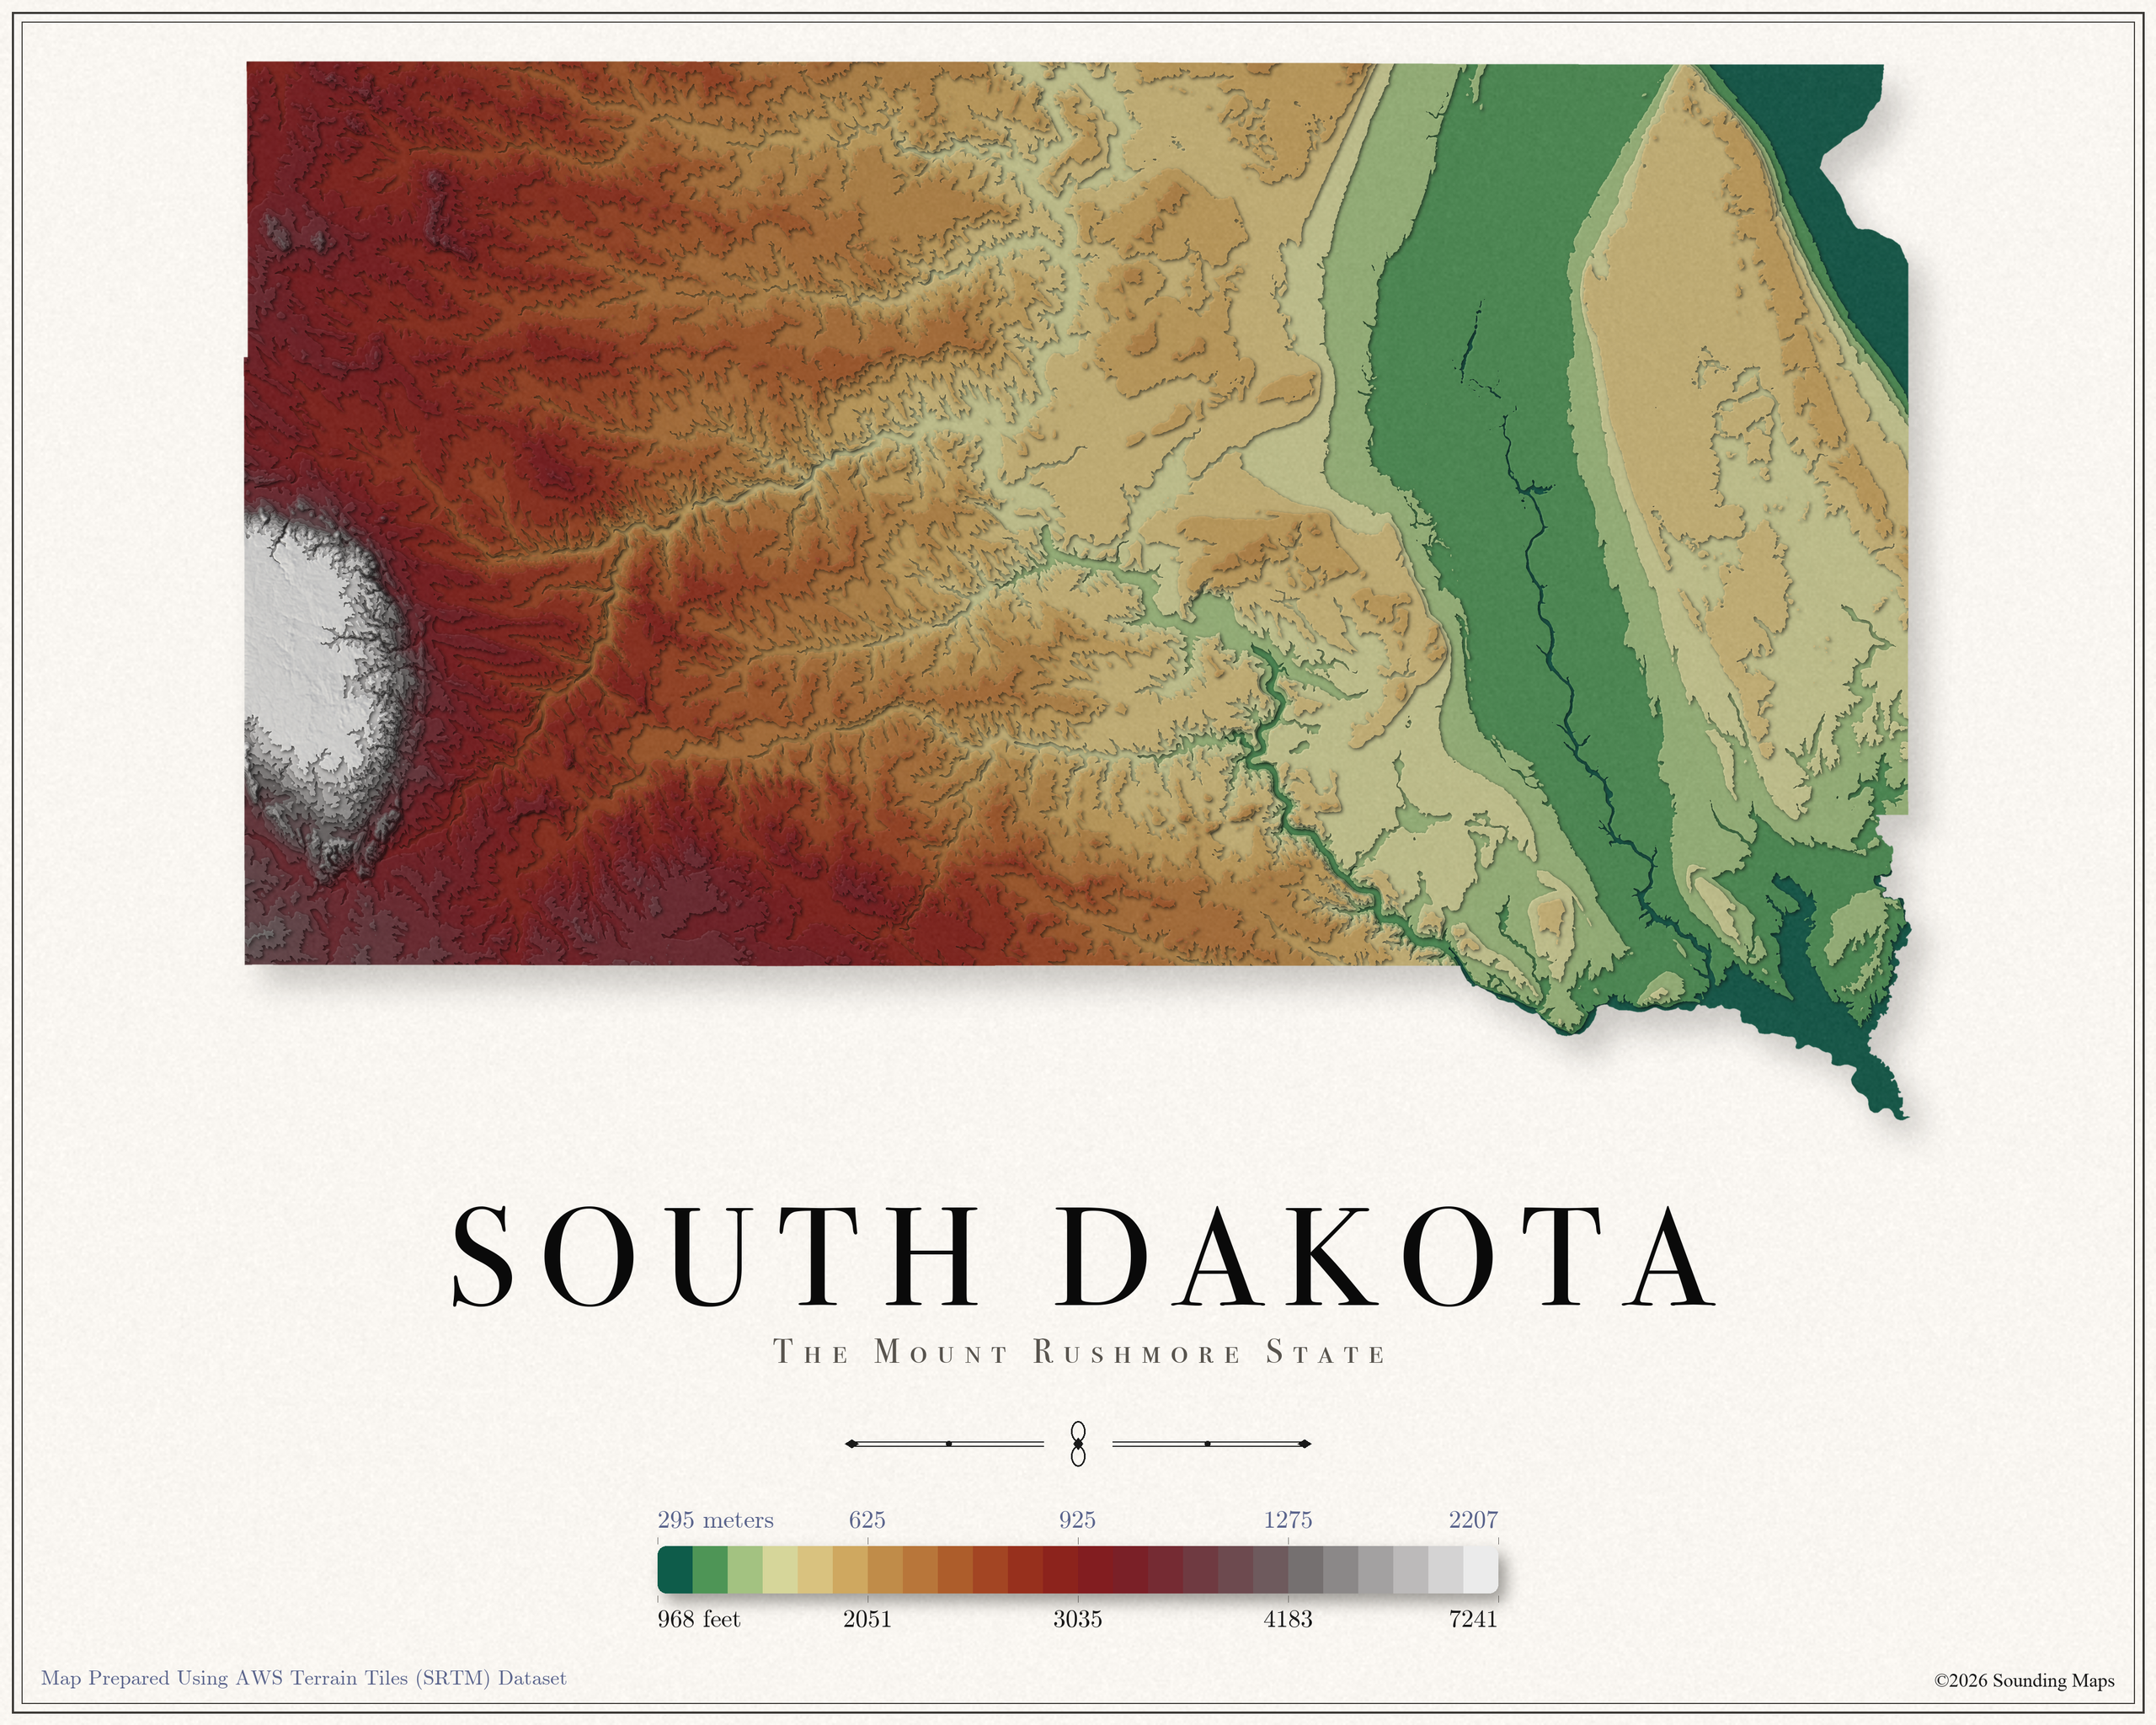
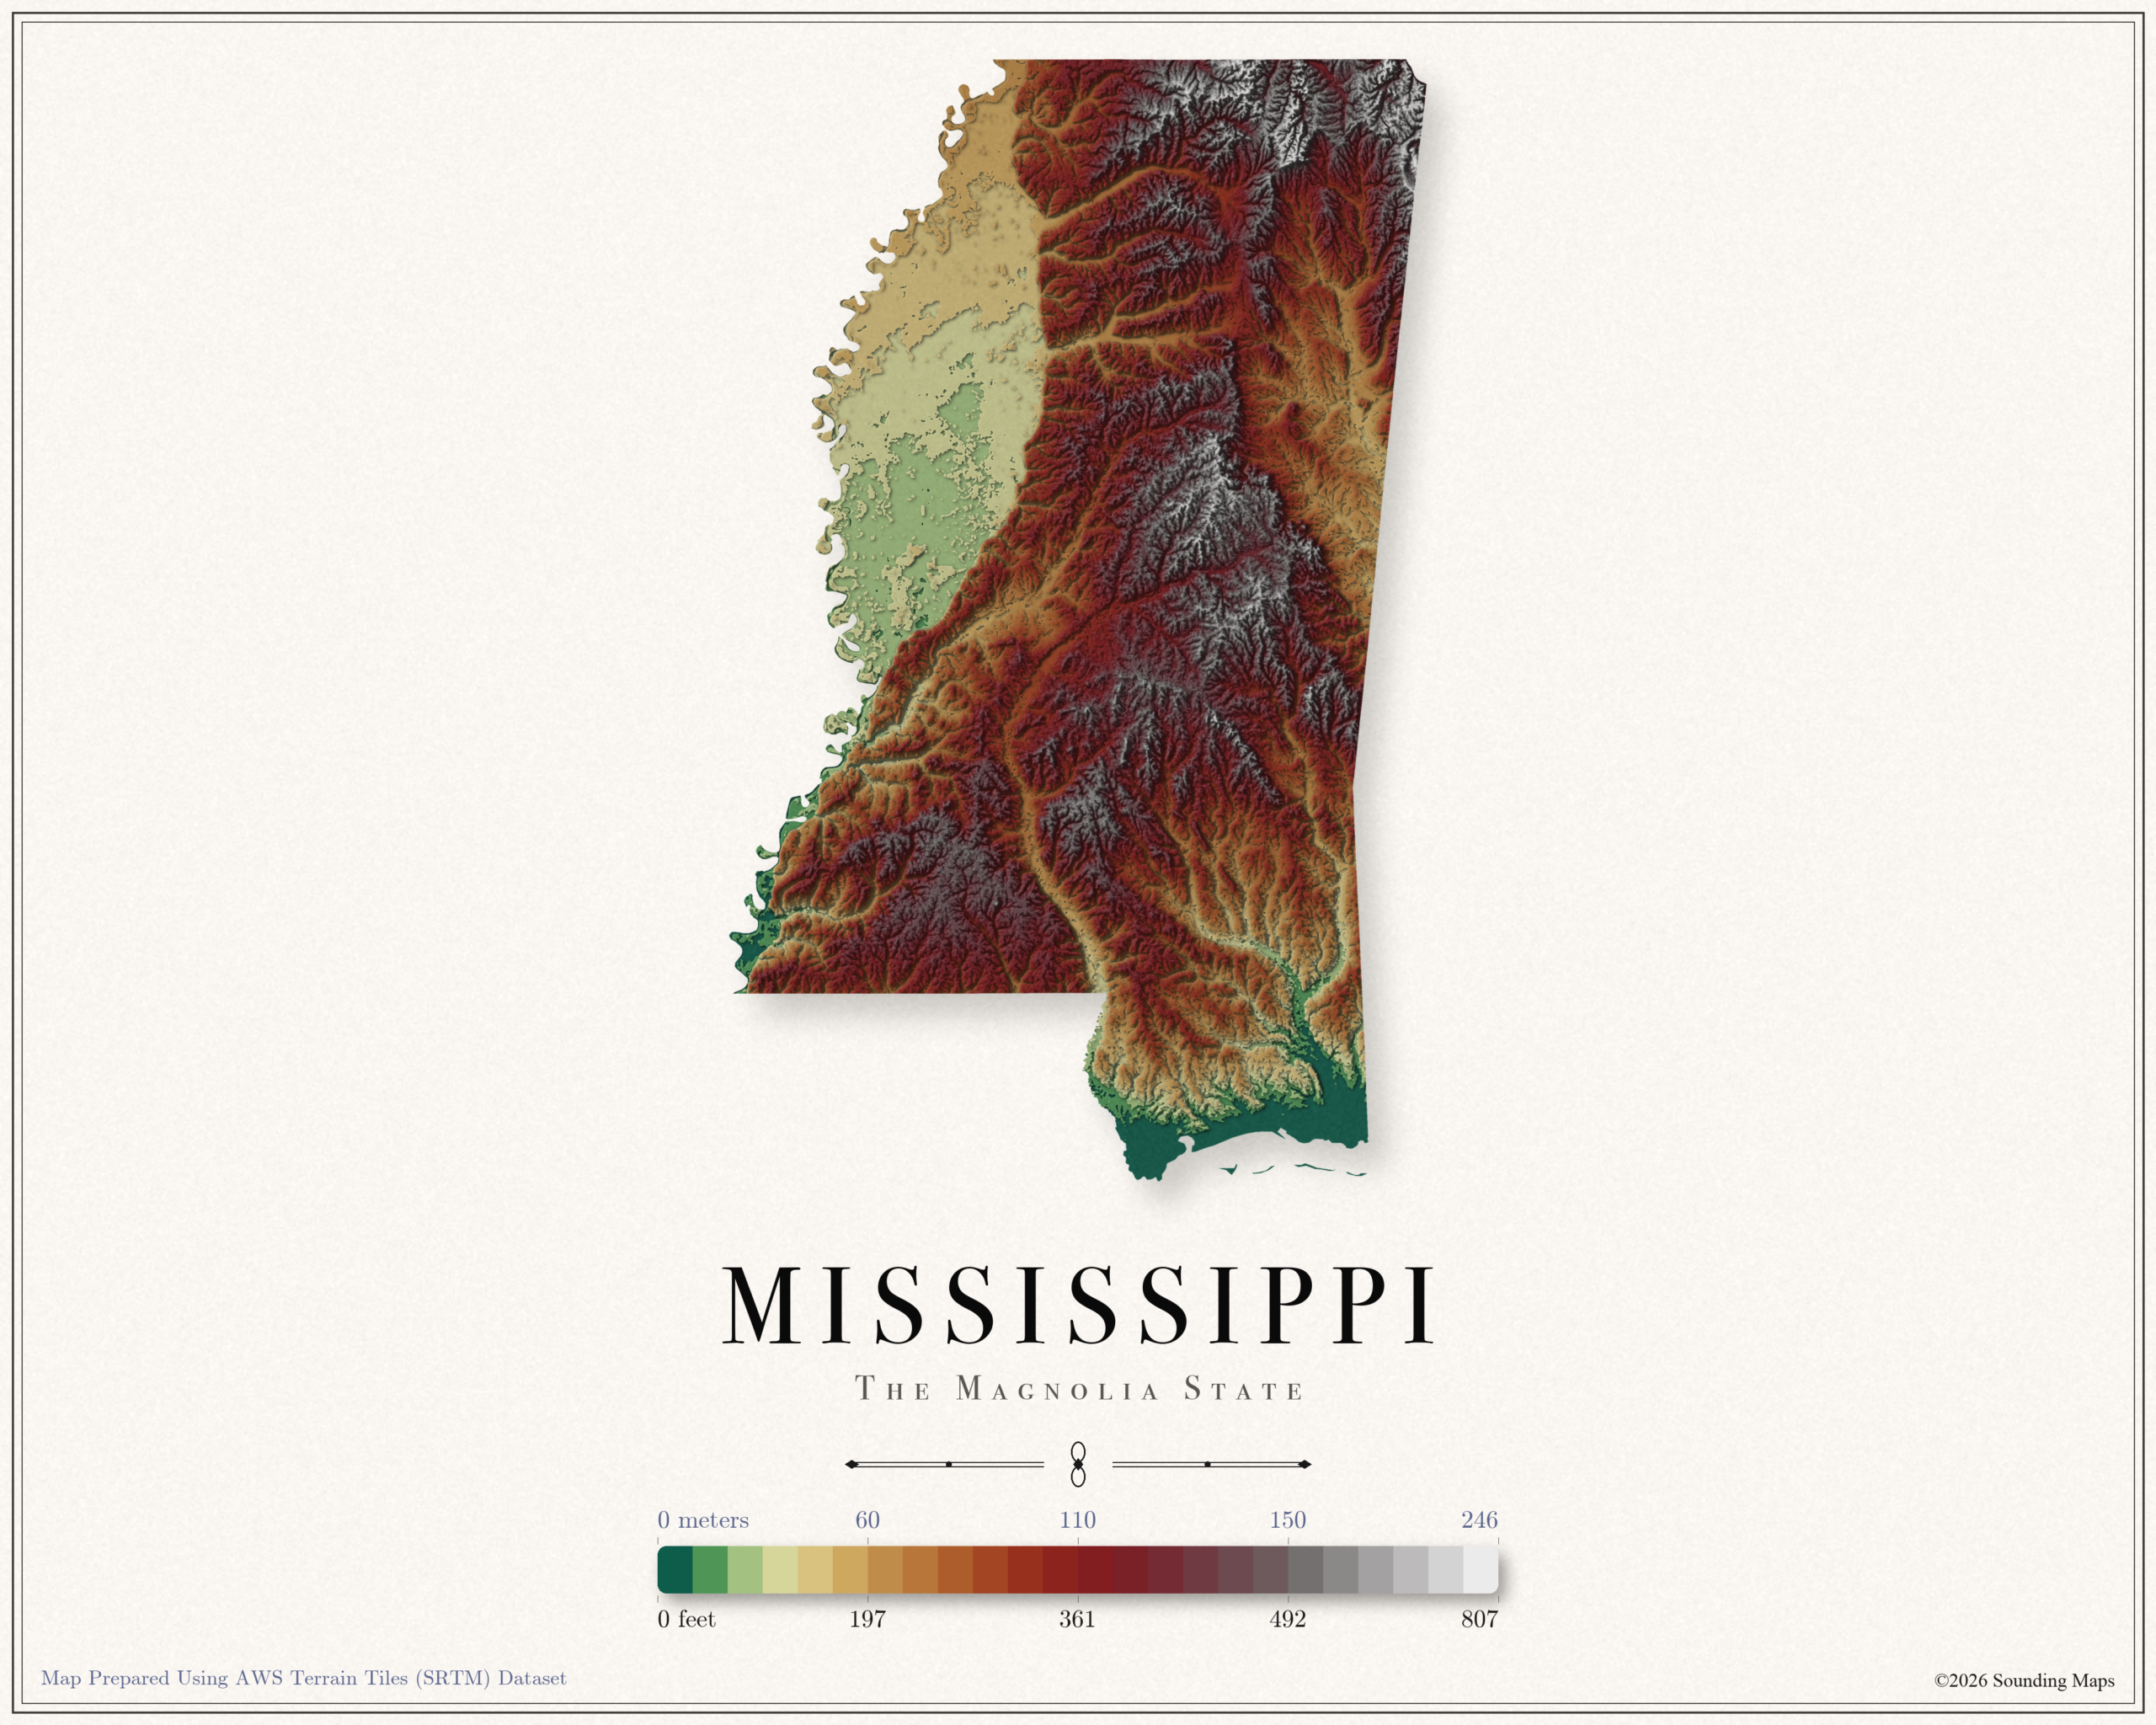
This Mississippi topographic elevation map shows the Magnolia State in 24 terraced elevation bands. The scale runs from 0 meters (0 ft) up to 246 meters (807 ft). Each band steps through the relief in sequence, so the map reads like a physical relief model. Lowlands appear in deep greens, middle elevations warm into golds and reds, and the highest terrain fades into grays and whites.
Mississippi covers about 125,438 square kilometers (48,431 sq mi). The bluffs along the Mississippi River trace a sharp topographic line down the western edge of the state, with the flat Delta pressed against them.
Highest Point in Mississippi
Woodall Mountain, at 807 ft (246 m), is the highest point in Mississippi. On this topographic map, it anchors the pale summit end of the elevation scale.
Lowest Point in Mississippi
Mississippi’s lowest elevation is sea level along its coastline. On the relief map, this terrain fills the deep green base of the color scale.
Mississippi Map Datasets
I prepared this relief map with elevation data from the AWS Terrain Tiles dataset. The dataset builds on the NASA Shuttle Radar Topography Mission (SRTM) along with other open topographic sources, and it serves global elevation data as map tiles that anyone can access.
The map spaces its 24 elevation bands with a blend of two methods. Half of the spacing follows equal elevation steps. The other half follows equal land area, a technique known as histogram equalization.
Why blend them?
A fixed interval scale would leave flatter regions sitting in a single color, which hides their topography. On the other hand, full histogram equalization would push a quarter of the land into summit tones. The blend lets this elevation map use the entire relief palette while the legend stays honest. Each label marks the true elevation behind its band, which is why the values are not evenly spaced.