
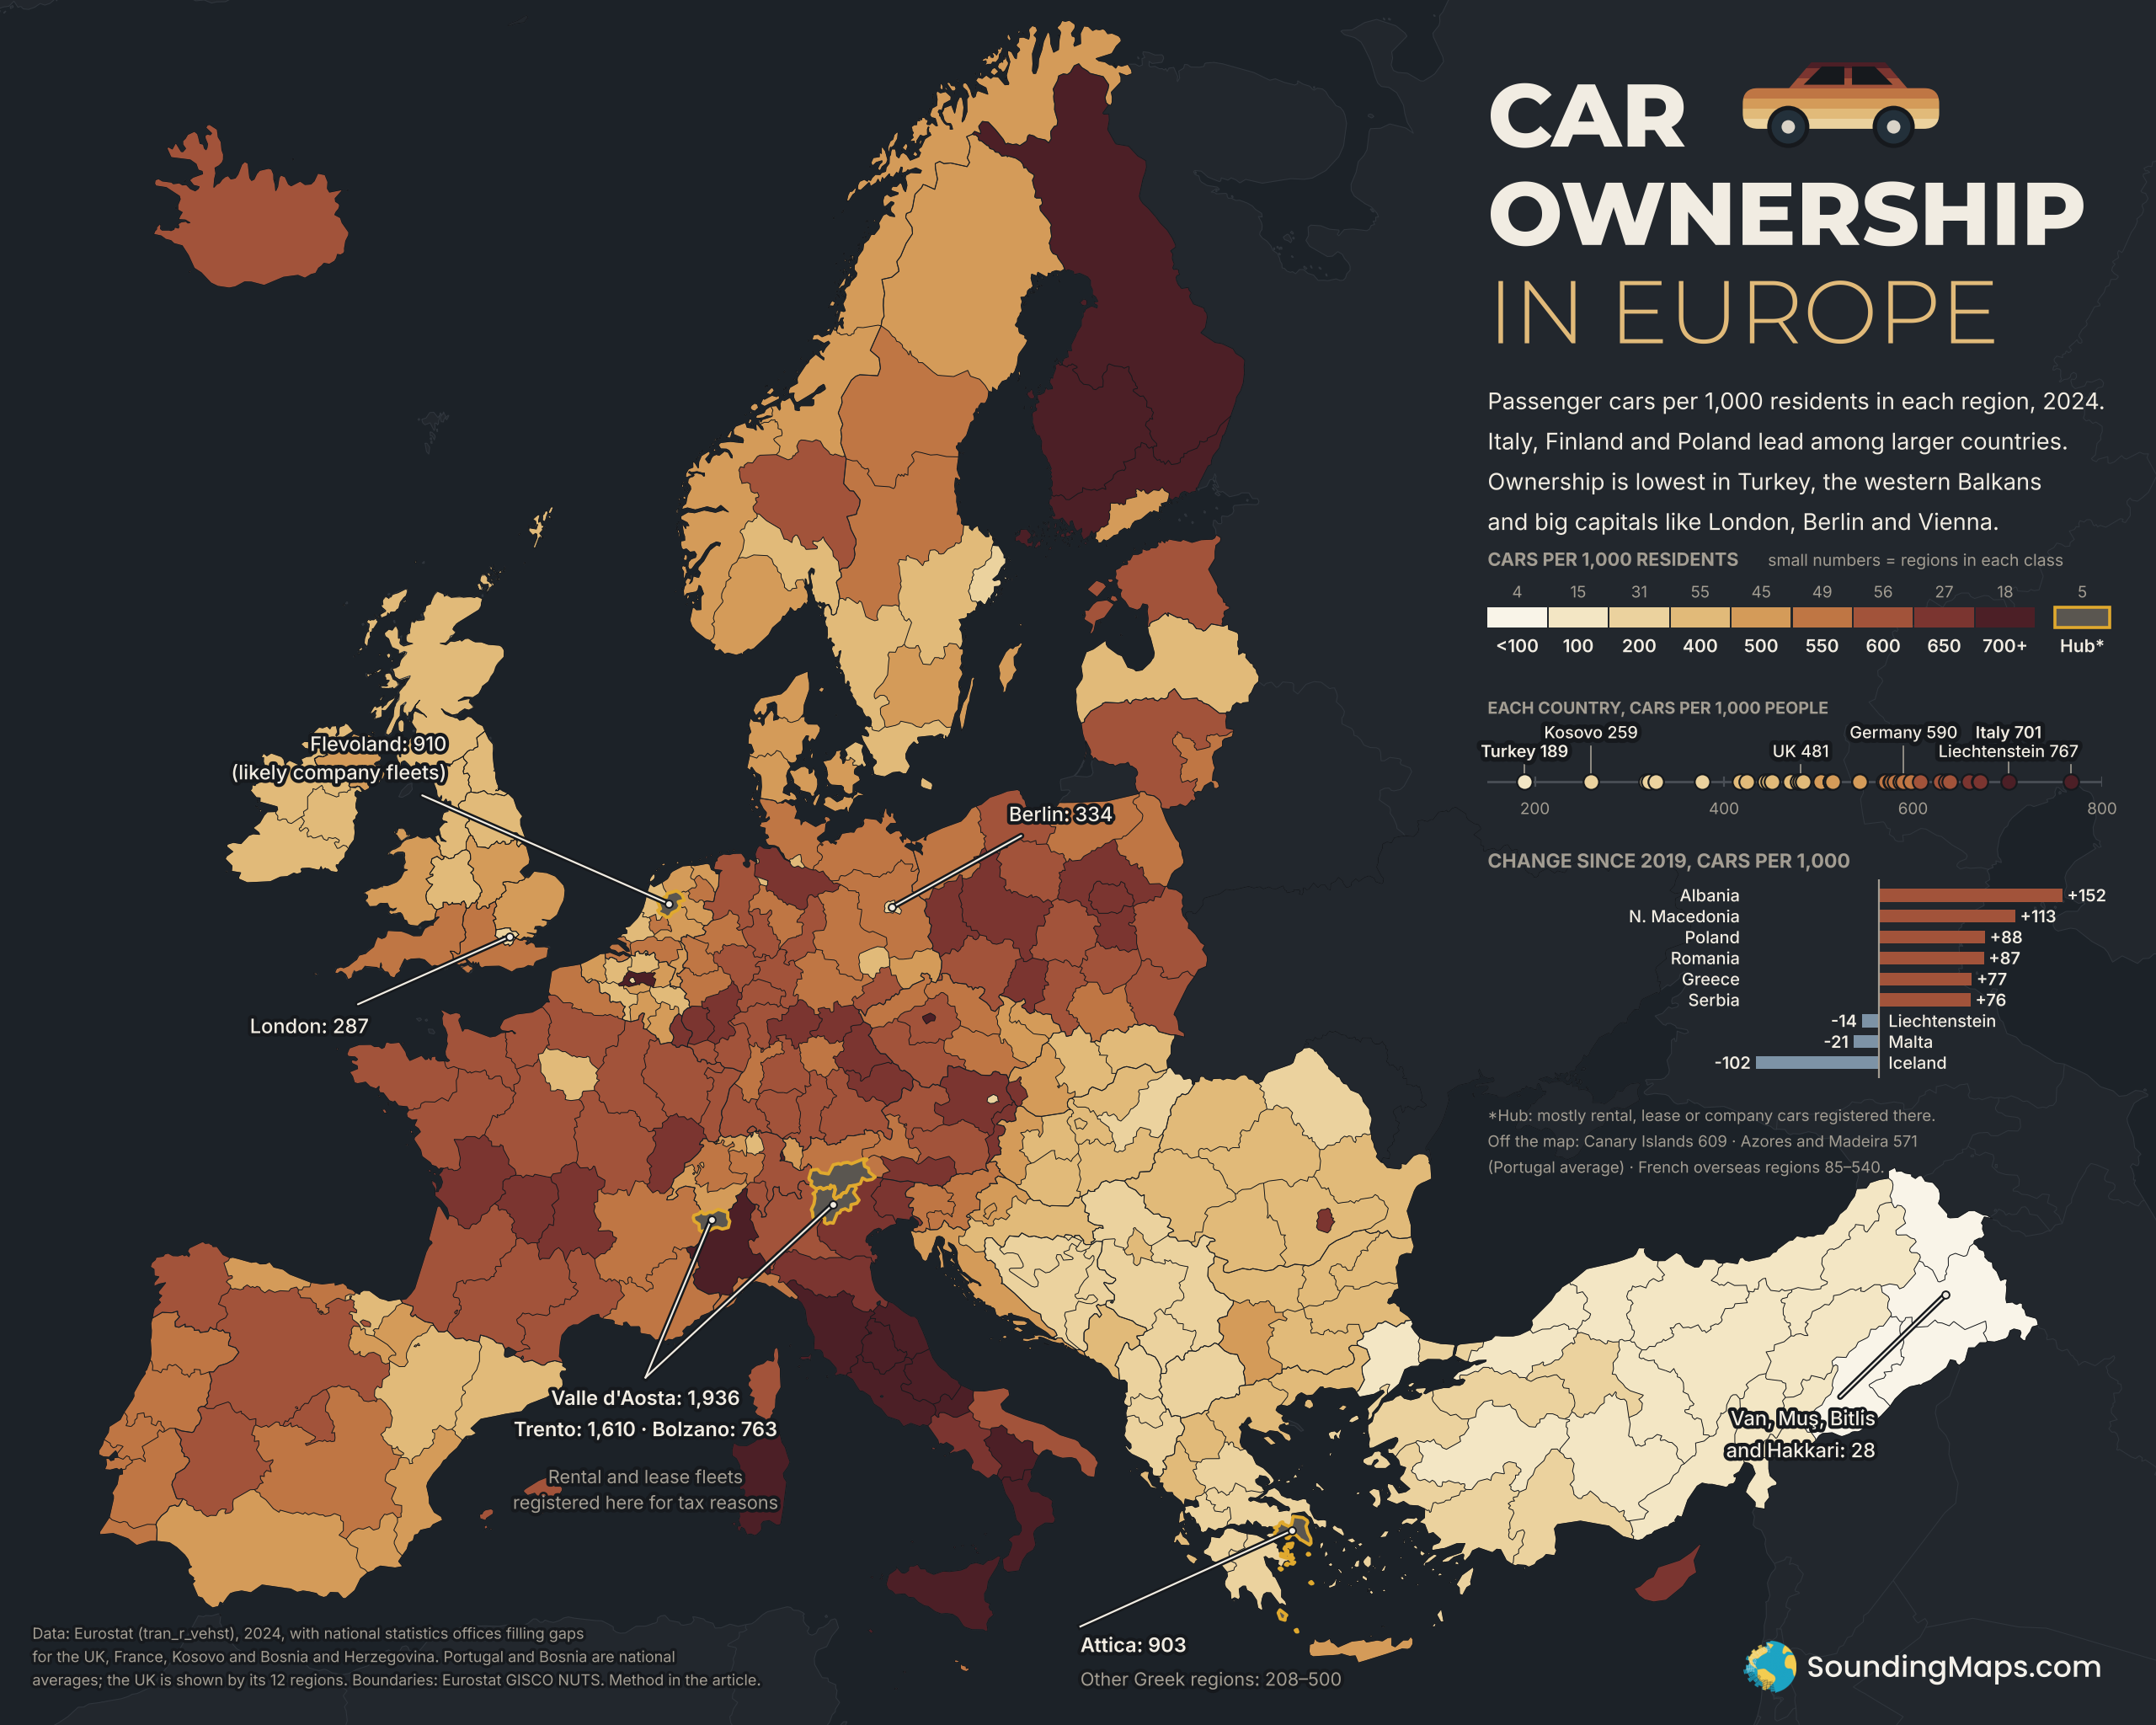
Berlin has 334 cars for every 1,000 residents. Brandenburg, the state around the city, has 584. Other Western European capitals show a similar gap with the regions around them. Several Central European capitals show the opposite.
What the map shows
Each region is colored by the number of registered passenger cars per 1,000 residents in 2024. The regions are Eurostat’s NUTS 2 regions, the standard mid-sized statistical units used across the EU. For the UK we used its 12 larger NUTS 1 regions. Coverage includes the EU, the EFTA countries and the candidate countries that report this figure. That brings in Turkey and most of the western Balkans. Eurostat has no figures for the UK, Bosnia and Herzegovina or Kosovo. We filled those in from each country’s own statistics office. The count covers passenger cars only, not vans or trucks, and divides by every resident, children included.
Italy leads, and Turkey trails
Liechtenstein has the most cars per person of any country in the data, at 767 per 1,000. Among larger countries, Italy leads with 701, ahead of Finland (671) and Poland (629). Small Luxembourg (670) and Cyprus (659) also rank high. Every Italian region except Liguria has more than 600 cars per 1,000 people.
Turkey has the fewest, with 189 per 1,000. Its eastern regions have the lowest figures on the map. Van, Muş, Bitlis and Hakkari together have just 28 cars per 1,000 residents. Kosovo has 259, the lowest national figure outside Turkey. North Macedonia (318), Bosnia and Herzegovina (321), Albania (328) and Serbia (377) are also well below the European norm.
Some richer countries have fewer cars than you might expect. Sweden has 470 per 1,000, Denmark 478 and the Netherlands 513. The UK as a whole has about 481. All are lower than Poland (629) or Czechia (608).
Capitals split east and west
The big Western European capitals rank low. London has the fewest of them, at 287 cars per 1,000, while South East England has 570. Berlin has 334, Vienna 363, Brussels 389 and Stockholm 398. Paris and its region have 433. These cities have dense public transport and expensive parking, and many households there live without a car. City households are also smaller, so a per-person count makes cities look emptier of cars than a per-household count would.
Central and Eastern European capitals look different. Prague has 761 cars per 1,000. The capital regions around Warsaw (685), Bratislava (681) and Bucharest (671) are also high. Some of that gap is real, since car ownership has grown fast in these countries. Company fleets may explain part of it, since firms often register cars at a head office in the capital.
Why some regions look impossible
Valle d’Aosta shows 1,936 cars per 1,000 people, nearly two per resident. Trento shows 1,610, and neighboring Bolzano 763. Rental and leasing companies register large fleets in these Italian provinces because their registration tax is lower. Statistics count each car where it is registered, not where it is driven. Flevoland in the Netherlands (910) also looks high, and company fleets probably explain part of it. Greece shows the same effect even more clearly. Attica, the region around Athens, has 903 cars per 1,000. No other Greek region tops 500, and the Peloponnese has just 208. Many Greek cars seem to be registered in Attica but driven elsewhere.
Europe car ownership growth Since 2019
Among the countries Eurostat covers, car ownership rose in most between 2019 and 2024. Albania gained 152 cars per 1,000 residents, North Macedonia 113, Poland 88 and Romania 87. A few places went the other way. Iceland fell by 102. Malta, Liechtenstein, Luxembourg, Norway and Switzerland also dipped slightly.
Methodology and sources
- Data: Eurostat dataset tran_r_vehst, “Stock of vehicles by category and NUTS 2 regions,” passenger cars per thousand inhabitants. We used 2024, the latest year, which every region with data reports. Eurostat marks Ireland’s 2024 figures as provisional.
- UK: Department for Transport table VEH0105 gives licensed cars at the end of 2024 for the 12 UK regions and nations. We divided these by ONS mid-2024 population. This counts licensed cars, not every registered car, so it may run slightly below a Eurostat-style figure. Cars “under disposal” are left out. The UK is shown at the larger NUTS 1 level.
- France: For seven of France’s 13 mainland regions, Eurostat reports only the larger NUTS 1 level. SDES commune-level data on cars in use on 1 January 2024 filled in the 16 missing NUTS 2 regions. INSEE population for the same date gave the denominator. As a check, this method matched Eurostat’s figures for the other six regions within about 1%. We then scaled each region slightly so its NUTS 1 total matches Eurostat exactly.
- Kosovo: The Kosovo Agency of Statistics counted 411,372 registered passenger cars in 2024. We divided that by the 2024 census population of 1,586,659.
- Bosnia and Herzegovina: 1,094,241 registered passenger cars in 2024 (Agency for Statistics of BiH), divided by its mid-2024 population estimate of 3,412,000. The source gives only a national total, so all three of its regions share one value.
- Portugal: Eurostat reports only a national total, so every Portuguese region, including the Azores and Madeira, shows that value.
- Not on the map: France’s overseas regions are left off for space. Their 2024 figures are Réunion 483, Guadeloupe 495, Martinique 540, Guyane 228 and Mayotte 85.
- Cyprus: the figure covers the government-controlled area, though the map colors the whole island.
- Boundaries: Eurostat GISCO NUTS 2024 boundaries from the Nuts2json project, with NUTS 2021 for the UK. The projection is ETRS89 Lambert azimuthal equal-area (EPSG:3035). Values for the Canary Islands, the Azores and Madeira, which fall outside the frame, appear in the side panel.
- Caveats: Registration location drives these numbers, so fleet hubs read high and some capitals may too. The map shows Valle d’Aosta, Trento, Bolzano, Flevoland and Attica in grey with a gold outline as likely hubs. Their values appear in labels but not in the color scale. Italian fleet-industry and regional press document the tax effect in Italy. Our explanations for Flevoland, Attica and the capitals are likely but not confirmed. Regional figures within Greece, and perhaps within other countries with a dominant capital, should be read with that in mind.