
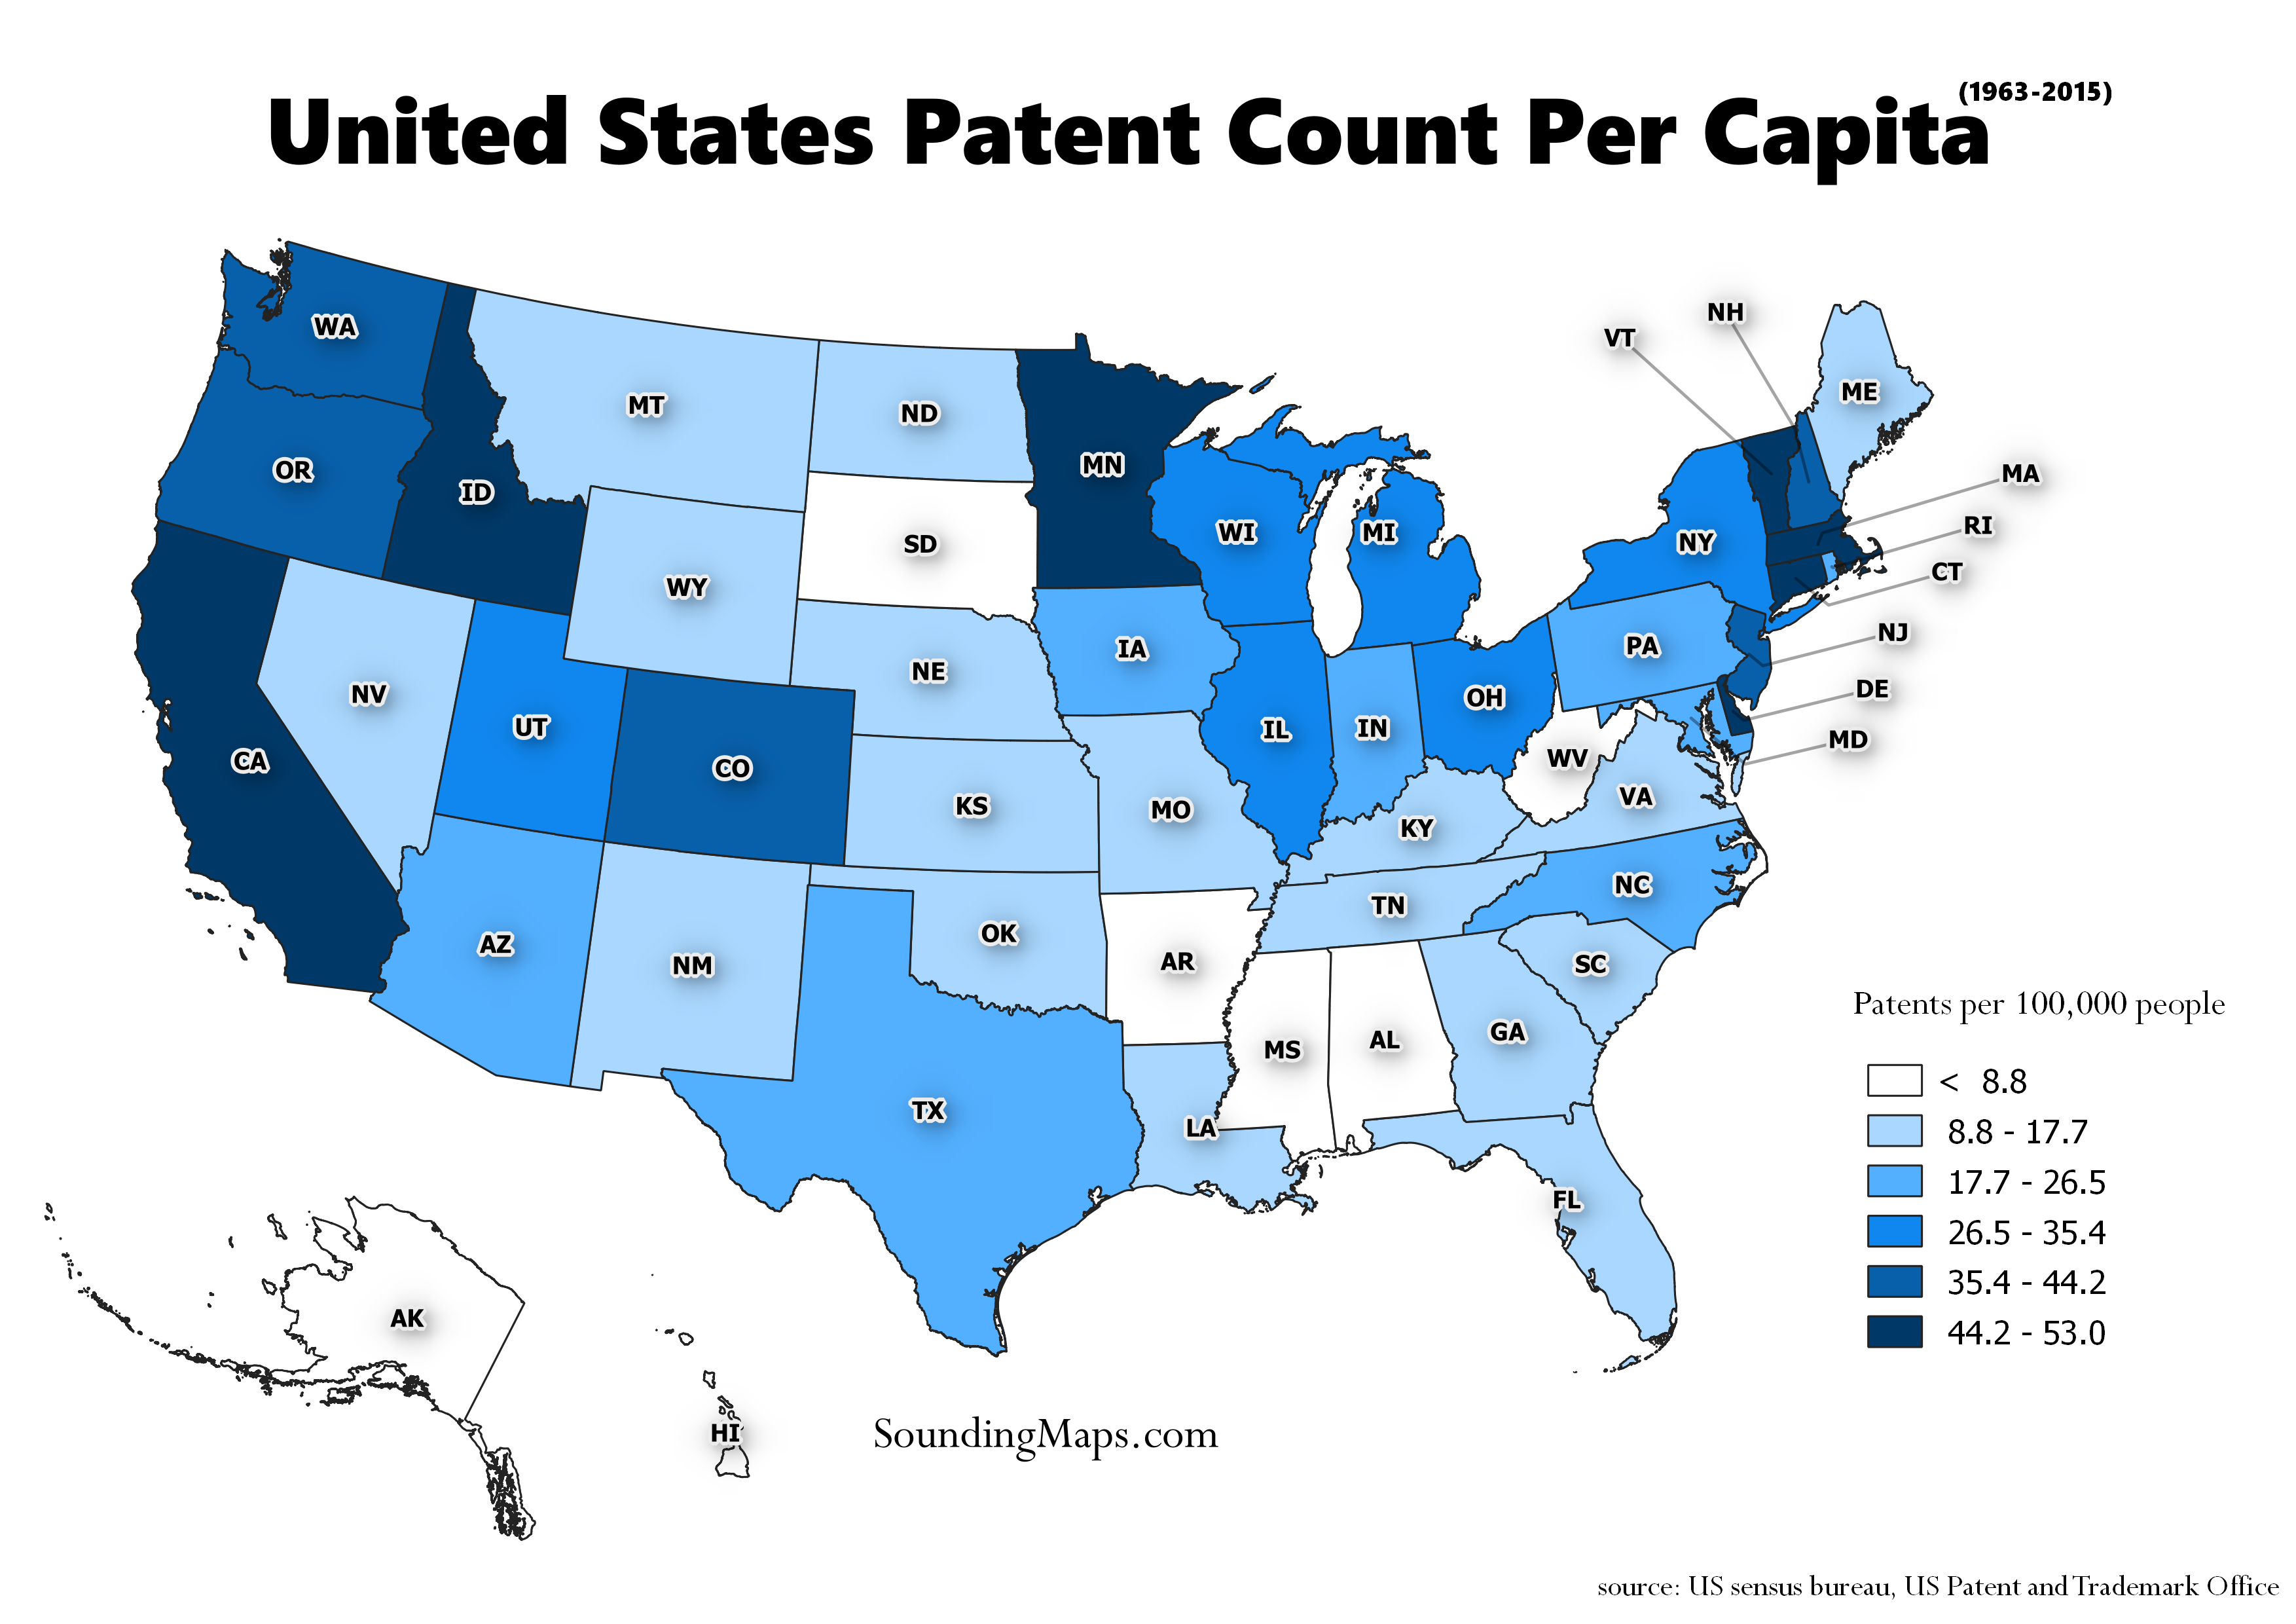
Overview of States with the most Patents This map visualizes the States with the most patents during the period 01/01/1963 – 12/31/2015. The residence of the first-named inventor determines the origin of a patent. Since the data comes from nearly half a century we normalized it over the years to represent […]
Monthly Archives: March 2019
3 posts
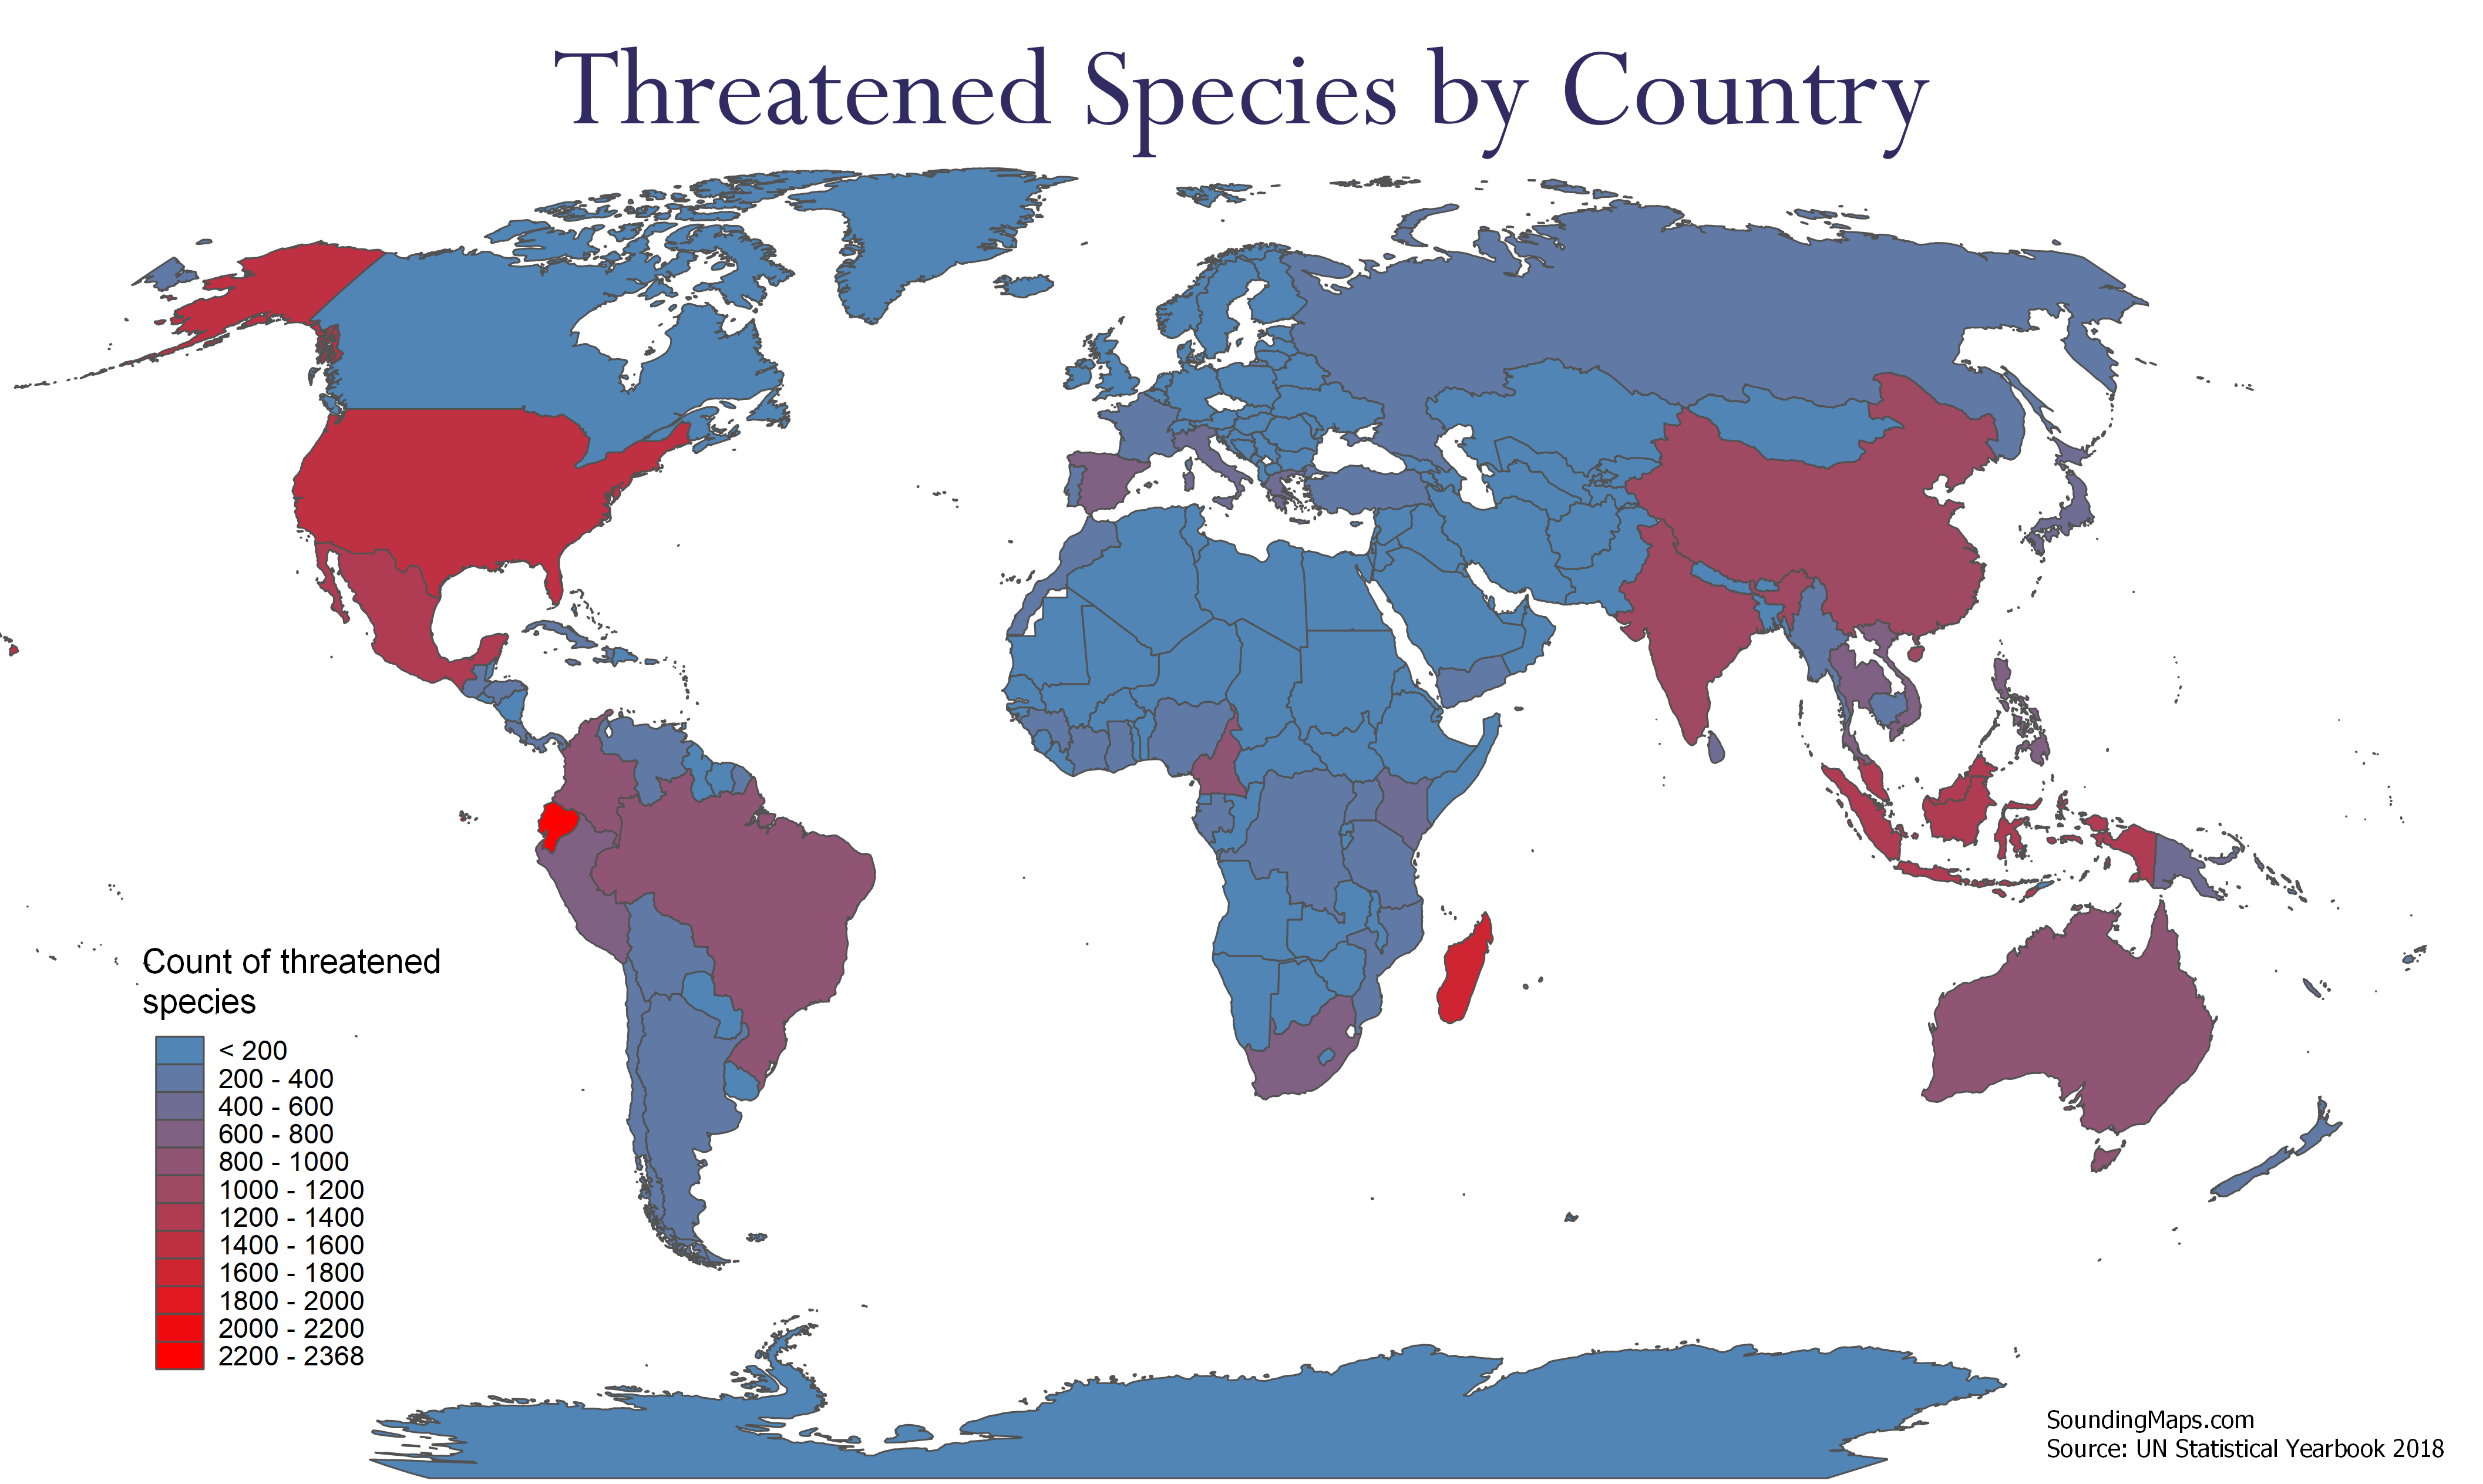
Countries With The Highest Amount of Threatened Species These maps visualizes the countries with a pronounced count of threatened species in 2018. The species include plants, vertebrates, and invertebrates. The threatened category refers to critically endangered, endangered, and vulnerable species. Data was pulled from the 2018 UN Statistical Yearbook 1. […]

We can visualize the percentage of native residents retained in each state. The darker shaded regions represent states that retain more of their native population. Evidently, not much is keeping people in Nevada. This data shows us where people are moving compared to retaining native population. What this means is […]